Beyond the Pill: Natural Ways to Fight Depression
Unfortunately, depression isn’t rare. Approximately 3.8% of people experience depression at any point during the year (including 5% of adults), and every individual has a 29% risk of being diagnosed with depression in their lifetime.
Although medication is a common treatment for depression, it’s not a cure-all. The response rate of a major symptom reduction is usually only 50–60%. (A placebo’s symptom reduction rate is 30–40%.)
Introduced in the 1980s, Prozac was the first selective serotonin reuptake inhibitor (SSRI). However, the difference between the drug effect and the placebo was slight, and so few studies showed efficacy that Pfizer had to cherry-pick studies to get FDA approval.
Drugs don’t cure depression. We still don’t understand the biochemistry behind depression, which is why our drugs’ efficacy is so poor.
Therapy has documented efficacy for depression. It’s harder to study than drugs, but medication and therapy combined can achieve up to an 80% reduction in symptom scores.
Because we don’t have a single depression-busting magic bullet, we treat it through stacking (also called the “everything but the kitchen sink” method). By bundling modalities, including natural ways to fight depression, we see more benefits than with any single treatment.
So, can depression be treated without medication? Absolutely.
A Physician’s Caveat
Medical literature offers varying degrees of support for natural ways to fight depression.
The safer a treatment, the more likely I am to recommend it to a patient even if it lacks strong, supportive data. It all comes down to the risk-benefit ratio — if a treatment’s risk is low enough, I’ll try it.
These therapies are safe, and I’m not bothered by the paucity of data on their efficacy. That said, don’t consider or use them in lieu of medication or therapies prescribed by your physician. Talk to your doctor first.
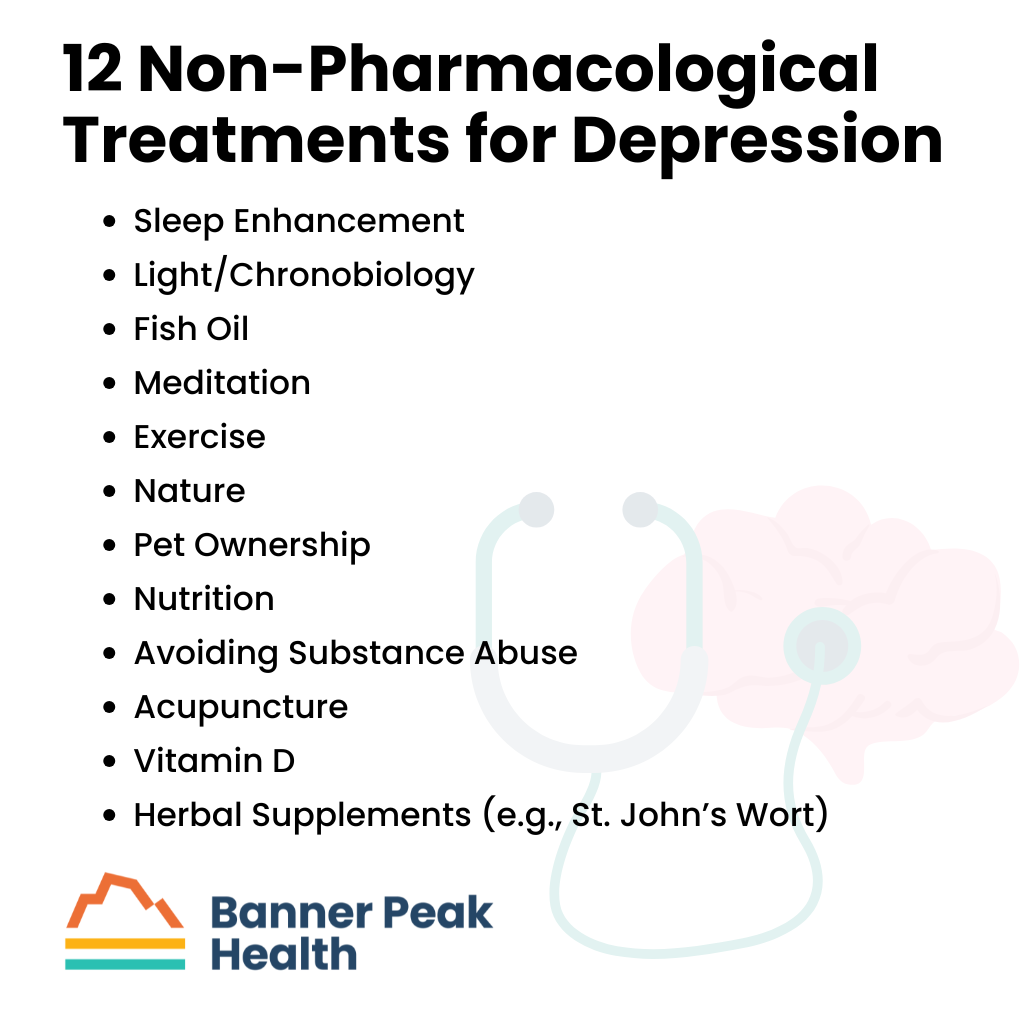
12 Non-Pharmacological Treatments for Depression
The following are my top recommendations on natural ways to fight depression and other non-pharmacological treatments for depression:
Sleep Enhancement
Sleep impairment is associated with emotional illness, including bipolar disorder and depression. Any action taken to enhance sleep mitigates these conditions’ symptom burden.
Every other treatment on this list improves sleep.
Light/Chronobiology
Circadian rhythm is a large component of emotional illnesses such as bipolar disorder and depression. Re-synchronizing your circadian rhythm with light therapy can play a prominent role in these therapies.
At Banner Peak Health, we recommend the TUO light bulb to help re-sync your circadian rhythm. Get as much morning light as possible, and be cautious of using sunglasses during the first few hours of the day. Morning light is a powerful signal for your circadian rhythm.
Fish Oil
While literature supporting its effects on the heart is controversial, literature supporting fish oil’s antidepressant effects is strong. Just one to two grams daily helps manage depression (and may also improve your heart health).
Meditation
Mental health is associated with greater sympathetic discharge (cortisol, stress, and anxiety). Meditation, including breathing exercises, reduces your stress response and improves your mental health.
Exercise
Aerobic and strength training exercises reduce stress, enhance sleep, and improve mood. It’s a valuable weapon in the fight against depression.
Nature
We’ve evolved over hundreds of thousands of years to exist in nature. Our urban environment is so new that we haven’t evolutionarily adapted to it yet. Exposing yourself to nature helps you harness your evolution to your benefit.
Pet Ownership
People who own pets or even have access to visiting pets in nursing facilities have better mental health.
We live more solitary lives than ever before in our evolutionary history. Any contact with human beings or pets connects us to how we evolved to survive, both physically and mentally.
Nutrition
When our mental health declines, we crave substances like sugar, fats, and caffeine that worsen, rather than improve, our emotional state.
To improve your mental health, adopt a healthier diet.
Avoiding Substance Abuse
When we’re not feeling our best, we gravitate toward substances that hurt our mental health. We’re better off when we eliminate marijuana, alcohol, nicotine, and other counterproductive exogenous substances from our lives.
Acupuncture
Acupuncture is a proven non-pharmacological treatment for depression. Anyone who’s had it has felt its calming, centering effects. It’s worth a try if it’s available in your area.
Vitamin D
Higher vitamin D levels are associated with many better medical outcomes, including mental health. However, whether taking supplemental vitamin D improves medical outcomes remains controversial. Fortunately, taking supplemental vitamin D is safe in almost all circumstances.
Of note, please discuss this with your doctor, as there are some rare conditions in which over-the-counter vitamin D may not be helpful.
Herbal Supplements (e.g., St. John’s Wort)
St. John’s Wort is one of many substances and herbal supplements recommended for treating depression. However, the data documenting their efficacy is meager, and the side-effect ratio for some supplements is not as benign as other modalities we’ve discussed.
For example, St. John’s Wort can cause the following side effects:
- Headaches
- Dry mouth
- Confusion
- Anxiety
- Stomach upset
- Drug interactions
I’m including St. John’s Wort and other herbal supplements for completeness, but the risk-benefit ratio is not as good as the other modalities on this list. People inevitably ask about them, but I’m not bullish on them.
Today’s Takeaways
Stress and depression are ever-present in our modern world. Fortunately, there are many effective non-pharmacological treatments for depression with exceptional risk-benefit ratios.
If you’re struggling with your mental health, please reach out to a therapist or schedule an appointment with a Banner Peak Health physician. We’re here to help.
If you need immediate assistance or know someone who does, help is available 24/7 at the Suicide and Crisis Lifeline. To access it, dial 988 from any phone.
How to Keep Your Knees Healthy: Preventing Injuries and Pain
With enough wear and tear, all mechanical devices (e.g., engines, hinges, tires, etc.) degrade.
For many years, conventional wisdom said the same about our knees. They were just biological hinges that would inevitably give out over time, especially with overuse, such as running. Trying to figure out how to keep your knees healthy was a lost cause, especially for athletes.
A study that began in 1984 turned this notion on its head.
How to Keep Your Knees Healthy: The Shocking Truth
Doctors at Stanford tracked two study groups to test the hypothesis that knees are analogous to mechanical hinges that wear out over time.
The study followed 45 recreational, long-distance runners and 53 non-runner controls over 18 years. The participants were predominantly men with a mean age of 58. The runners had at least 10 years of running experience and ran an average of five hours per week.
At the beginning of the study, 6.7% of the runners and 0% of the non-runners showed X-ray evidence of arthritis. The participants had X-rays of their knees taken every few years.
At the end of the 18-year study, the results flabbergasted everyone: 20% of the runners had evidence of some form of arthritis, while 32% of the controls did. Even more startling? Only 2.2% of the runners had severe, disabling arthritis, while 9.4% of the controls did.
The non-running controls had over four times the rate of severe arthritis in their knees as the runners. The results contradicted the original hypothesis and debunked the myth that running damages knees.
Important Caveats
The study’s participants were:
- Uninjured
- Mostly men
- Over age 50
- Recreational, long-distance runners
The study definitively answered whether knees wear out over time for that population. They don’t.
Unpacking the Conventional Wisdom
Where did the notion that athletes have “bad” knees (or are destined to) come from?
Countervailing literature on high-intensity sports, including ballet, soccer, wrestling, and weightlifting, shows that athletes can have three to six times the level of degenerative arthritis as non-athletes.
When you examine the literature for sports that have increased rates of degenerative arthritis and remove injured athletes, there’s no increased risk of degenerative arthritis. The literature tells us that running makes a healthy, uninjured knee healthier.
Conversely, a sport that injures a knee causes the knee to wear out faster. The goal is to safely participate in sports that can strengthen the knee without injuring it. How can you find the right balance?
Let’s examine the knee’s anatomy to understand why this happens and how to keep your knees healthy with appropriate exercise.
The Knee’s Anatomy
The knee contains “hard stuff” and “less hard stuff.”
The “hard stuff” is bones:
- Femur
- Patella
- Tibia
- Fibula
The “less hard stuff” is cartilaginous tissue, tendons, and ligaments:
- Lateral meniscus
- Medial meniscus
- Lateral collateral ligament
- Medial collateral ligament
- Anterior cruciate ligament
The lateral and medial meniscus act like washers to cushion the areas between the bones. The ligaments connect the bones and align your knee.
When the anatomy works well, exercise perfuses the soft tissues and cartilage. Cartilage is avascular, meaning it contains few or no blood vessels. The medial meniscus, for example, gets nutrition from the synovial fluid.
Synovial fluid bathes and lubricates the entire knee joint when you move your knee. The more effectively you move your knee, the more you nourish those soft tissues.
If you injure your knee — for instance, if you tear a meniscus or ligament — you change the knee’s mechanical alignment. At that point, you’ve disturbed the anatomy of the knee and changed how the force is distributed within the joint, which increases your likelihood of generative arthritis and joint wear.
In contrast, maintaining an injury-free knee strengthens it.
How to Keep Your Knees Healthy
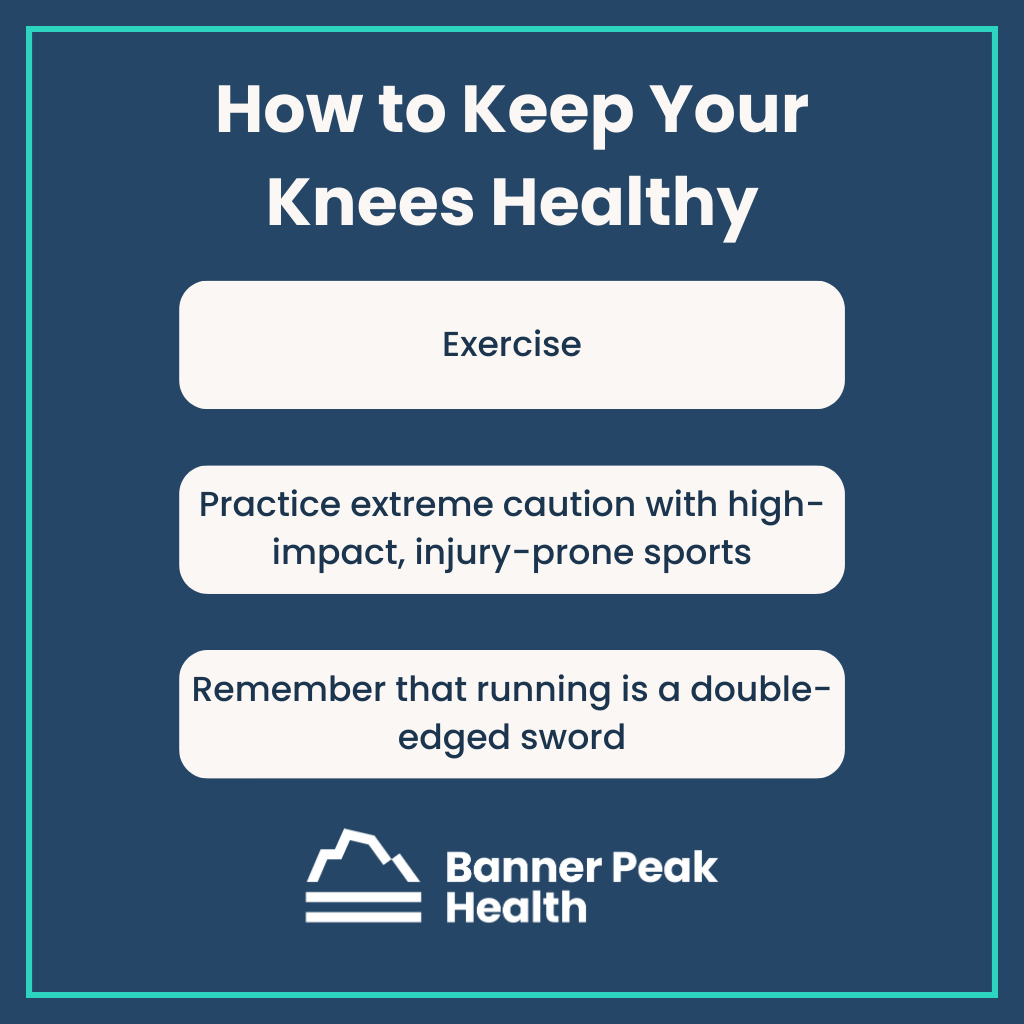
With this understanding of anatomy and pathophysiology, here’s how to keep your knees healthy:
- Exercise. It strengthens the bones and enhances the knee’s surrounding musculature, protecting and aligning it. Exercise also moves the synovial fluid around, maintaining cartilage health.
- Practice extreme caution with high-impact, injury-prone sports. Every sport, even running, can injure you. If you participate in high-risk sports, maintain your flexibility and strength, and don’t overdo it.
- Remember that running is a double-edged sword. When done properly, it’s good for your knees, but if you injure your knees while running, your risk of arthritis increases. Practice safe running techniques:
- Pay attention to your gait. Watch videos online or talk to a coach.
- Wear appropriate footwear. Use insoles if you need them for proper alignment.
- Avoid carrying extra body weight if possible, but if you must, maintain strength and flexibility. Extra weight demands more of your knees.
If you feel pain, remember that musculoskeletal pain is a message from your body. Don’t ignore it. Figure out what your body is trying to tell you.
Knee pain can be a valuable lesson if you listen to your body and decipher its message. Did you run too far? Do you have a bad gait? Do you need different shoes? Listening to your body is the best way to keep your knees healthy.
At Banner Peak Health, we’re proud to offer the resources you need to achieve optimal health through our Outperform program, including access to fitness instructors. Contact us today to take advantage.
Your Guide to Belly Breathing: Benefits, Techniques, and More
I’m 62 years old and have taken about 500 million breaths. Recently, I learned that most of these breaths were done improperly.
Why do we breathe? We take in oxygen for our metabolism to generate energy. We exhale CO2 (metabolism’s byproduct) to expel it from our bodies.
Given the vital necessity of breathing, we’ve evolved a complicated, sometimes redundant breathing mechanism. It involves a multitude of muscles that expand the lungs (to inhale) and natural elasticity that contracts them (to exhale). The muscles involved are:
- In the neck
- In the shoulder girdle
- In the chest wall
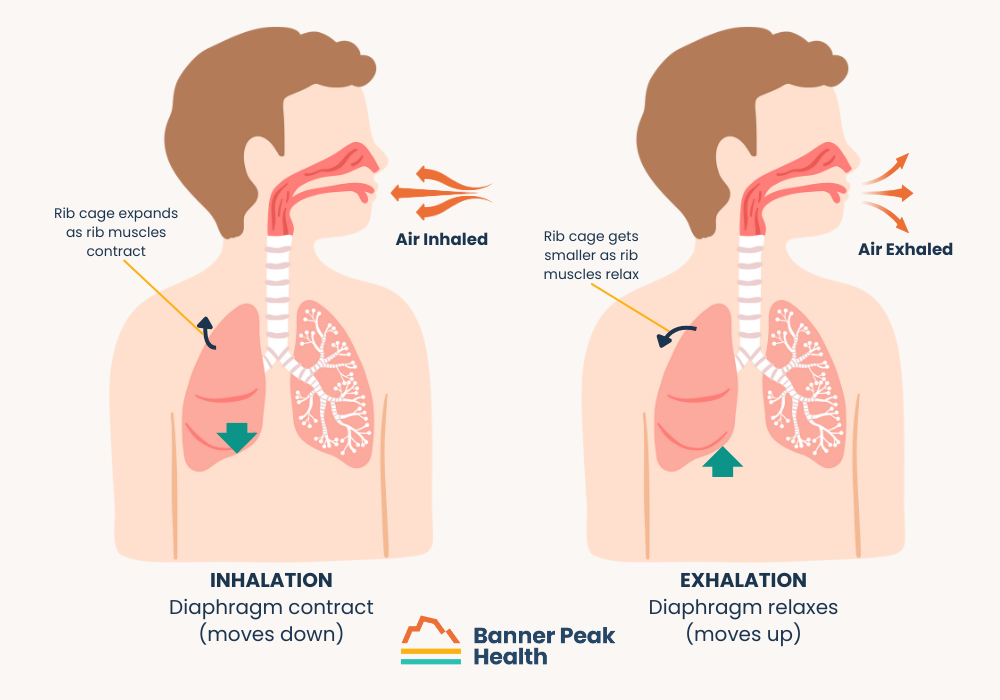
- The diaphragm (one big muscle that lines the bottom of our lungs and depresses)
These muscles make up the redundant anatomy, which we use in different combinations.
Different Forms of Breathing
There are two types of breathing: chest breathing and belly breathing.
Chest breathing is the predominant type and involves the muscles on the sides of the rib cage, in the neck, and in the shoulder girdle.
Belly breathing, or diaphragmatic breathing, relies on the diaphragm to depress the lungs into the abdominal cavity and enlarge them.
 How Breathing Develops
As newborns and young children, we default to belly or diaphragmatic breathing. It’s more efficient — bringing the diaphragm down expands the lungs more efficiently than chest breathing.
Because of the functioning of our nervous systems, most of us transition to chest breathing at some point in life. As we become more anxious, we become more sympathetically driven (i.e., the sympathetic nervous system, fight or flight) in how our autonomic nervous systems coordinate our breathing. We tend to take more shallow, rapid breaths with our chest walls.
Belly breathing is more calming. It involves a more parasympathetic (i.e., rest and digest) tone that consists of the diaphragm coming downward.
The Cycle of Stressful Breathing
Improper breathing creates a vicious cycle: We breathe improperly because we’re stressed, and our breathing mechanism becomes more stressed (sympathetically driven) because we breathe improperly.
So, how can we escape the cycle?
We can retrain our bodies to use distinctively diaphragmatic breathing like babies do. Watching a baby breathe, you’ll see the tummy move up and down. That’s the kind of breathing you want to mimic.
Retraining Your Brain to Breathe Right
The autonomic nervous system is a two-way street. It causes us to breathe a certain way; however, if we consciously breathe a certain way, we can rebalance our autonomic nervous system.
This rebalancing begins with consciously recapturing (or relearning) diaphragmatic breathing.
Benefits of Diaphragmatic (Belly) Breathing
Studies show many benefits associated with belly breathing. The most common are:
- Increased parasympathetic tone, which can lead to:
- Increased heart rate variability
- Reduced anxiety
- Reduced cortisol
- Reduced blood pressure
- Reduced heart rate
- More effective and efficient breathing:
- More oxygen is taken in
- More CO2 is expelled
- Increased athletic performance
- Improved cognition
- Reduction in GERD (gastroesophageal reflux disease)
- Reduced neck stress
- Improved posture
Organs below the diaphragm and muscles above it work better with belly breathing. People who belly breathe experience less stress in their neck and shoulder muscles and also have less gastroesophageal reflux.
How to Practice Belly Breathing
Although breathing is an unconscious process, we can reprogram our default (how our unconscious breathing works) through conscious training.
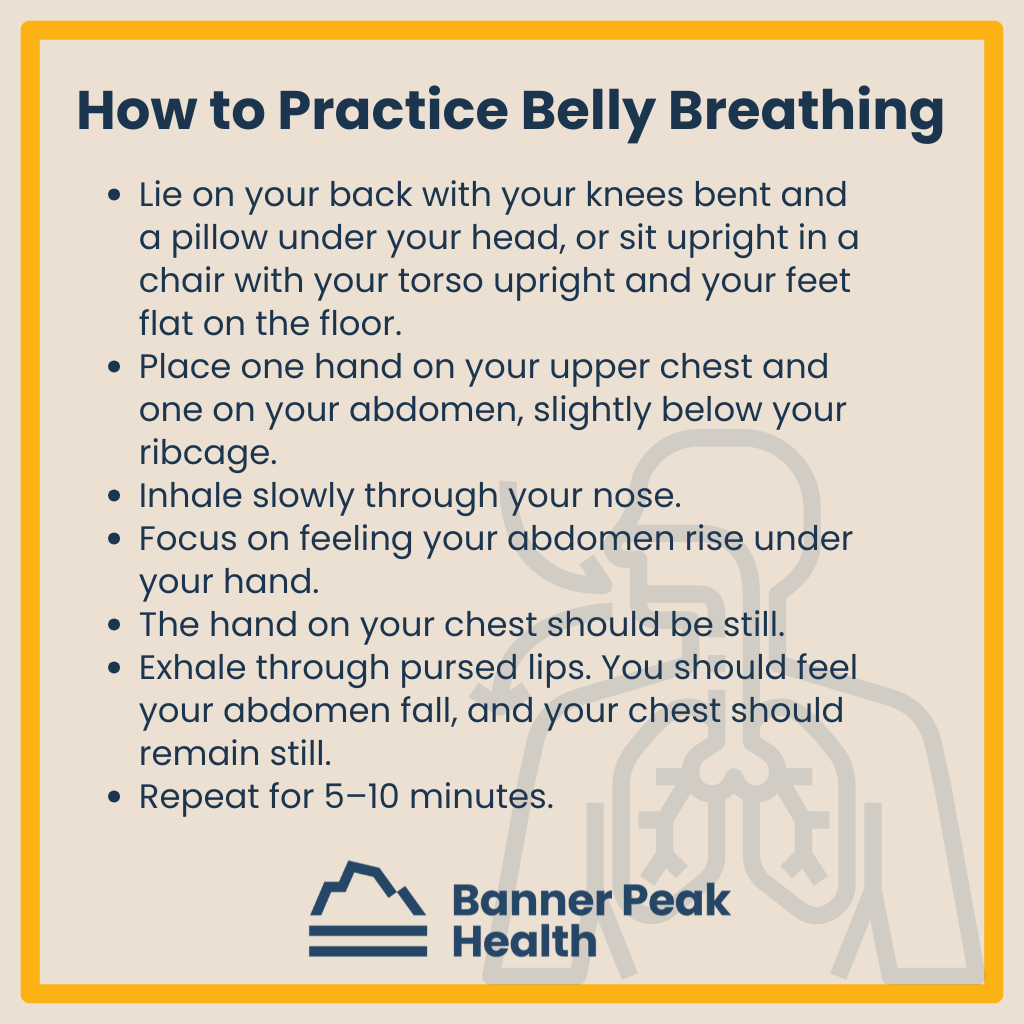
To apply this training, follow these instructions for five to 10 minutes, three to four times daily:
- Lie on your back with your knees bent and a pillow under your head, or sit upright in a chair with your torso upright and your feet flat on the floor.
- Place one hand on your upper chest and one on your abdomen, slightly below your ribcage.
- Inhale slowly through your nose.
- Focus on feeling your abdomen rise under your hand.
- The hand on your chest should be still.
- Exhale through pursed lips. You should feel your abdomen fall, and your chest should remain still.
- Repeat for 5–10 minutes.
Let your hands guide you. If the hand on your chest moves, you’ve got it wrong. Correct your inhalation so only the hand on your abdomen moves.
You’ll have to think about every single breath. Eventually, this technique will lead to a shift in your automatic breathing.
As-Needed Breathing Techniques
We all deal with stressful situations in which focused breathing can help us relax. These techniques will help you do just that, and plenty of literature supports their efficacy.
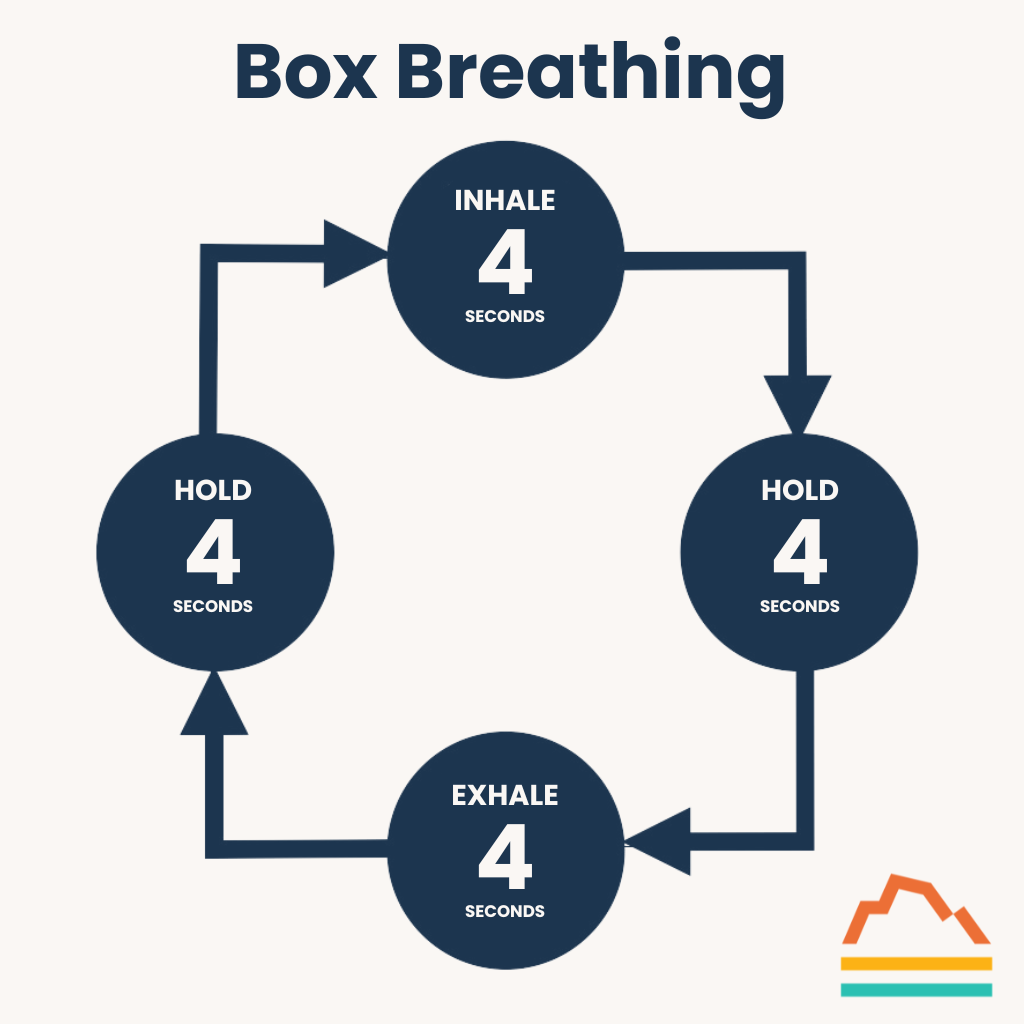
Box Breathing
Box breathing is perfect for improving focus and marshaling your resources when you’re feeling overwhelmed. Don’t think of it as just another hippy-dippy, granola-loving new-age practice. Navy SEALs and tactical police officers use it in high-stress situations.
Here’s how to start:
- Inhale for a count of four.
- Hold your breath for a count of four.
- Exhale for a count of four.
- Hold your breath for a count of four.
- Repeat.
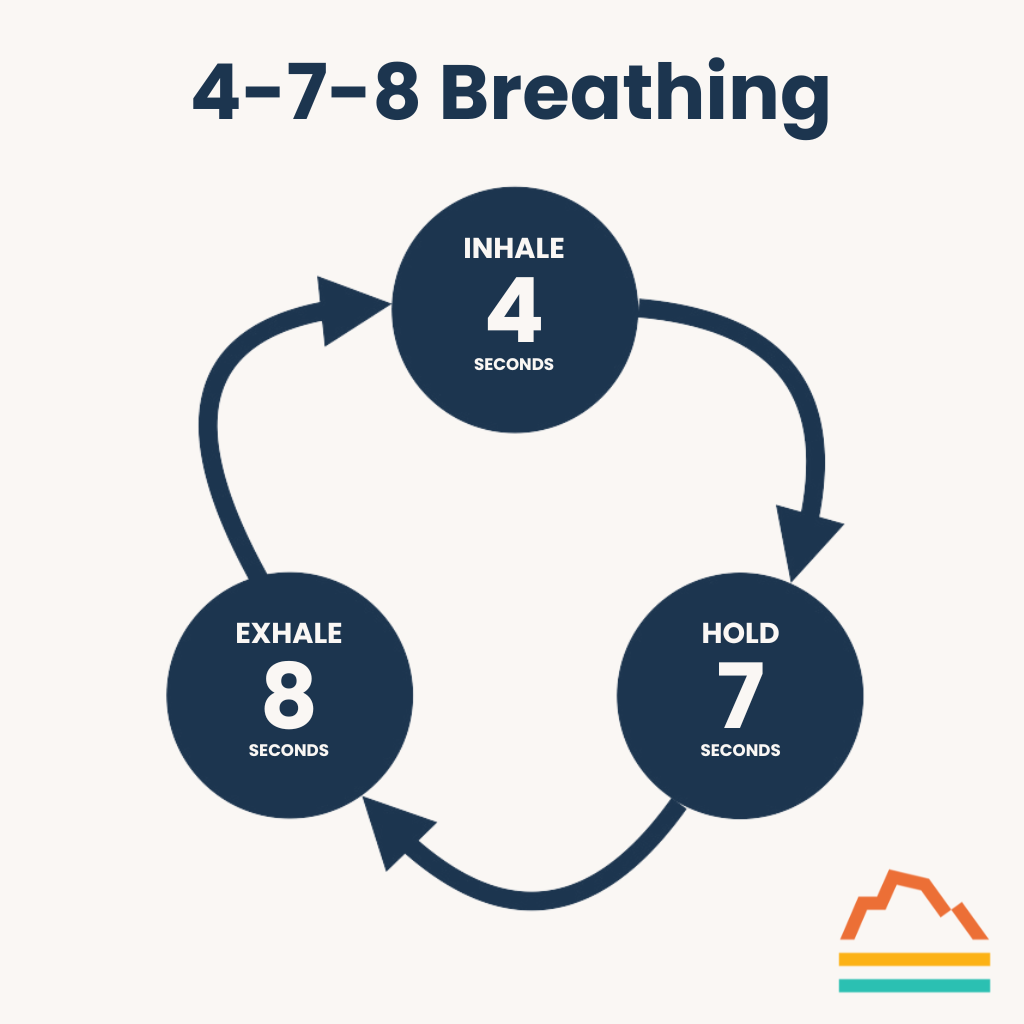
4-7-8 Breathing
When you’re feeling anxious or stressed, the 4-7-8 breathing technique can help. Many people also find it useful when they have trouble falling asleep.
Here’s how to practice it:
- Inhale through your nose into your belly (use belly breathing) for four seconds.
- Hold your breath for seven seconds.
- Exhale slowly through pursed lips for eight seconds.
- Repeat.
Today’s Takeaways
After so many blogs chronicling stress’s adverse effects, I’m happy to offer practical, cheap, operational techniques to tip the scales in the other direction.
Try paying attention to how you breathe. See if making a conscious effort to revert back to belly breathing improves your life.
Identifying the latest science-backed ways to improve your health is a huge part of what we do at Banner Peak Health. If you want to learn how we can help you improve yours, we’re just a phone call or email away.
How to Lower Diastolic Blood Pressure
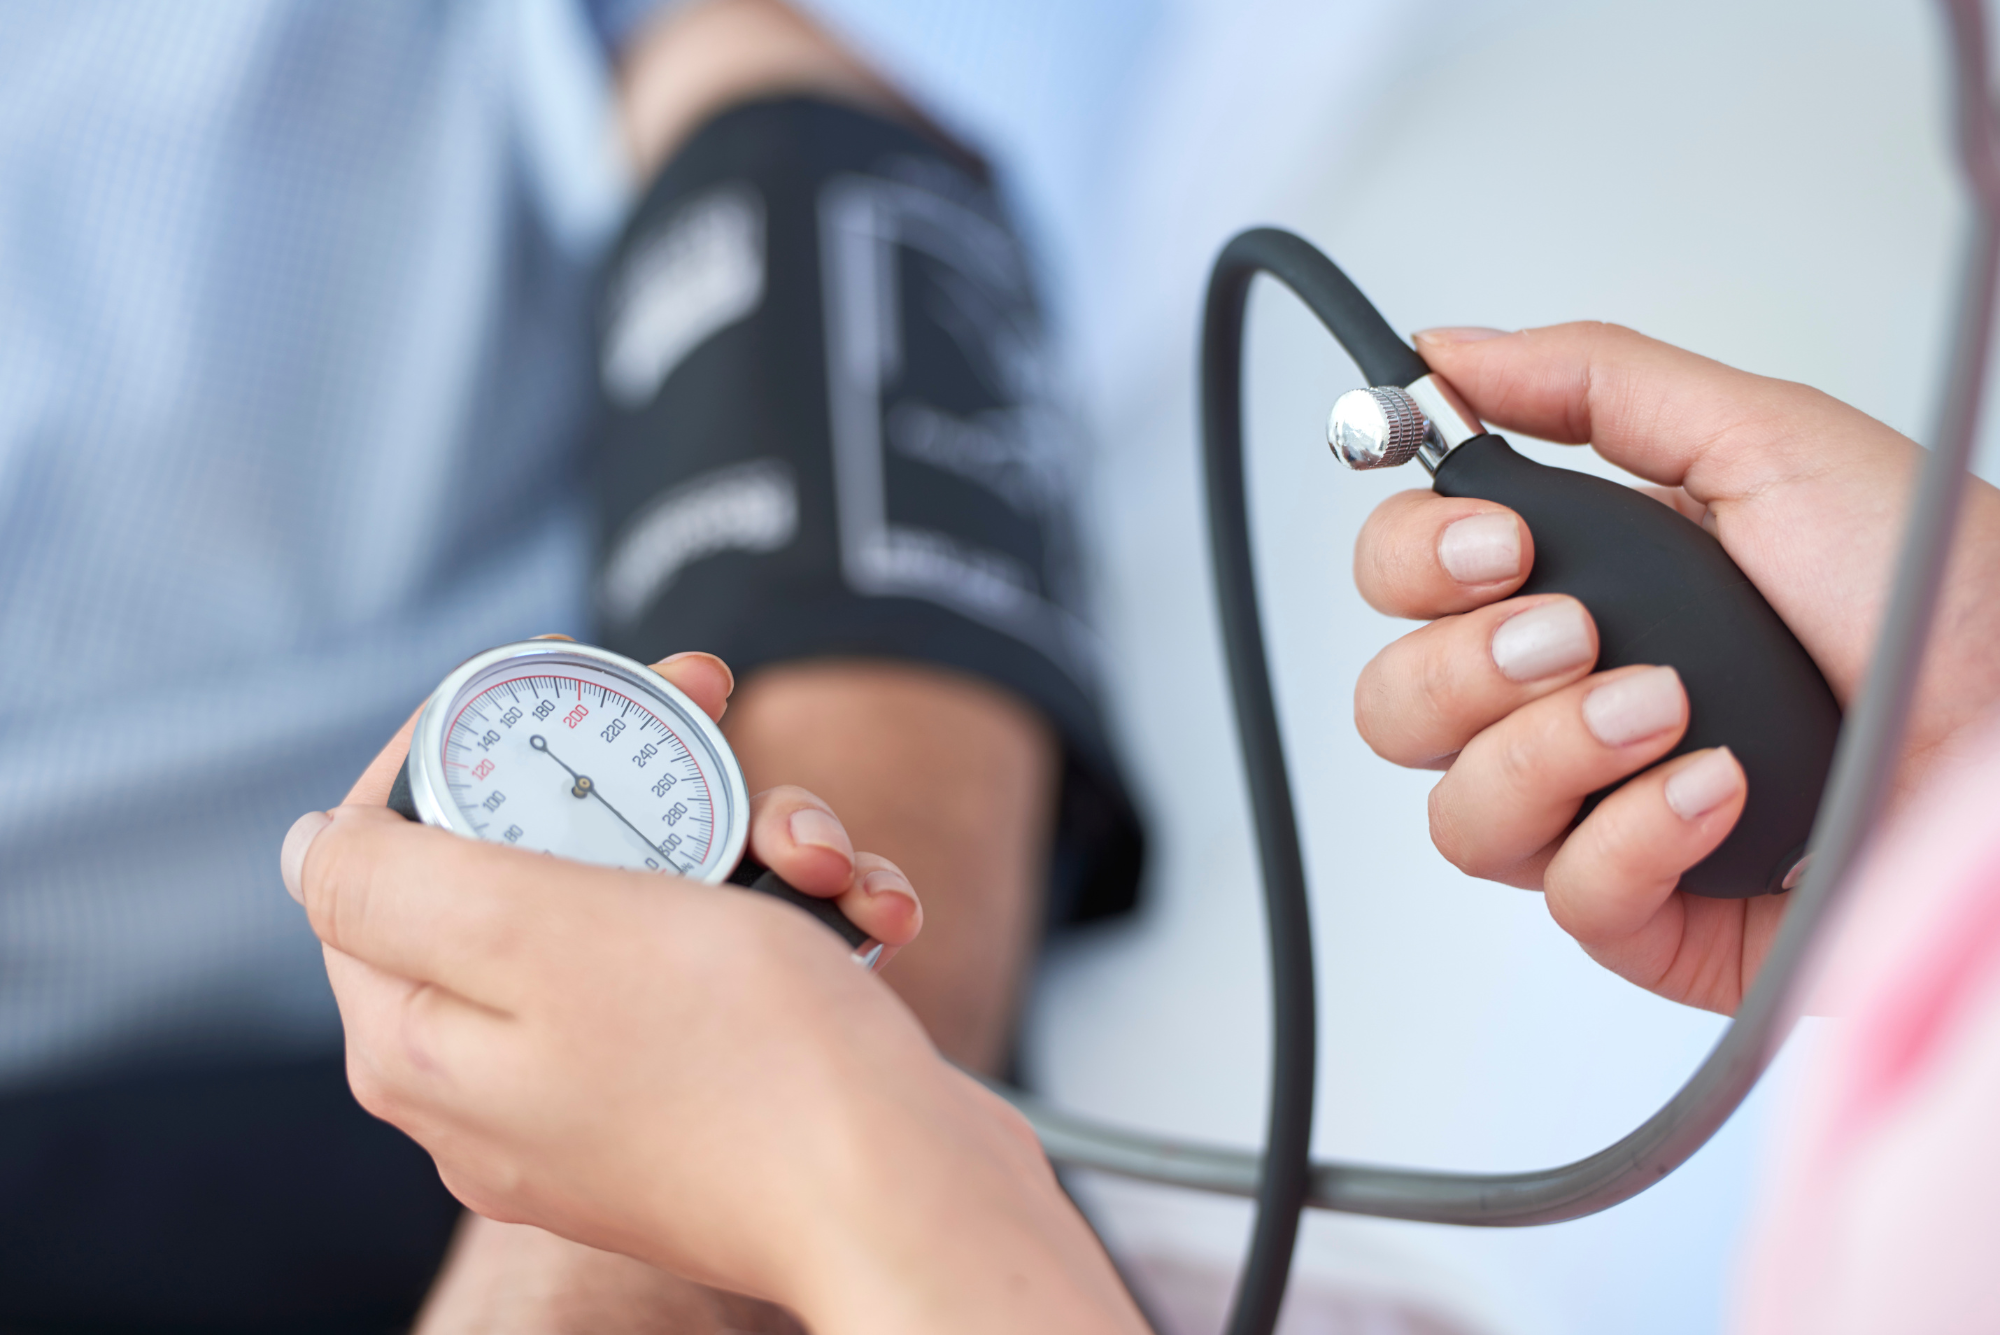
You might be curious about your blood pressure. However, it’s not a single measurement because the doctor gives you two numbers. What do those numbers mean?
The top (larger) number is your systolic blood pressure, while the bottom (smaller) number is your diastolic blood pressure.
Do you know how to lower diastolic blood pressure if it’s too high?
 Systolic and Diastolic Blood Pressure
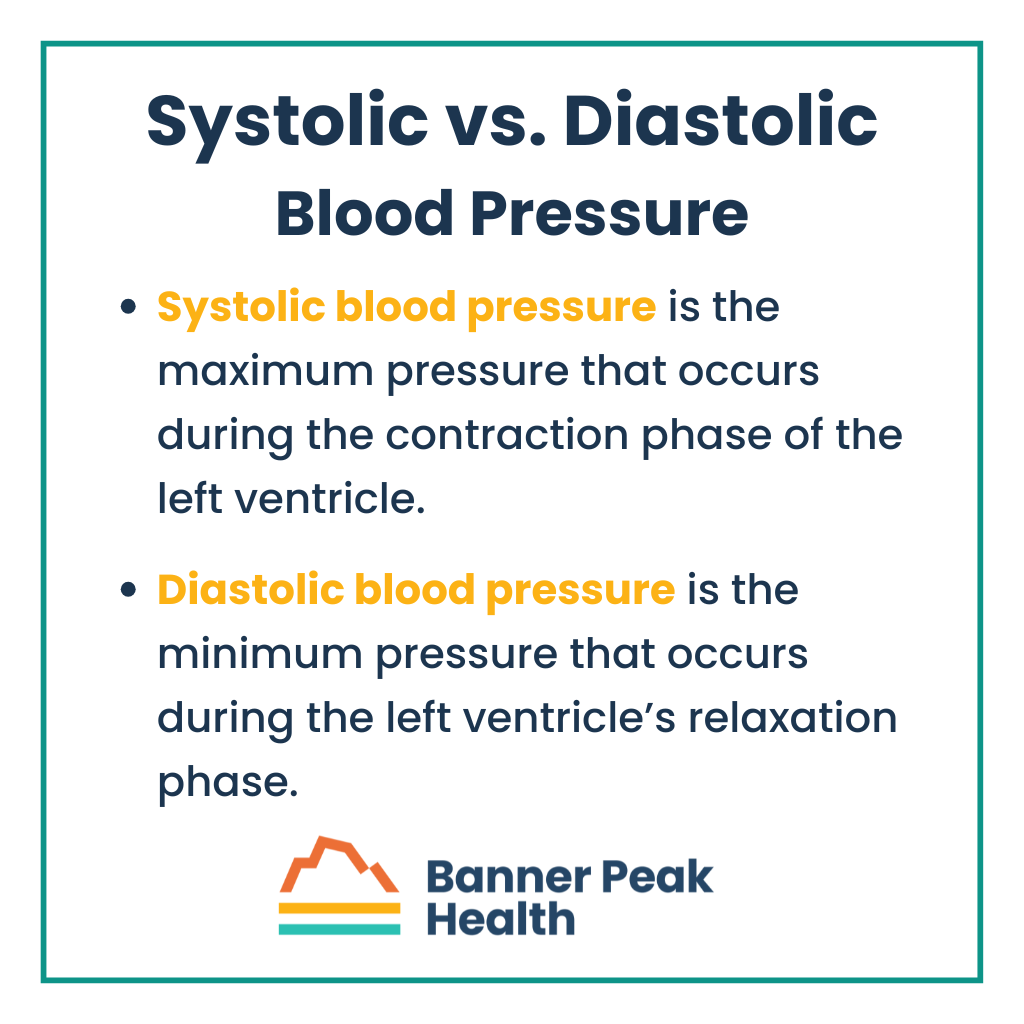
Systolic blood pressure is the maximum pressure that occurs during the contraction phase of the left ventricle, the portion of the heart that pumps blood through the arteries of the body.
Diastolic blood pressure is the minimum pressure that occurs during the left ventricle’s relaxation phase.
Your blood pressure varies according to physiological changes, and readings can change due to sampling and measurement errors. Obtaining an accurate blood pressure reading can be challenging, and normal blood pressure isn’t as straightforward as it seems.
However, knowing your overall blood pressure and whether it tends to run high is important since this indicates many health risks.
High Blood Pressure Causes
Systolic pressure is primarily influenced by the stiffening of the larger arteries. As we age, our arteries have more exposure to illnesses such as high blood pressure, diabetes, and elevated cholesterol that can thicken the artery walls and reduce compliance. (And, yes, high blood pressure can cause further high blood pressure, which is why timely diagnosis and treatment are vital.)
Imagine trying to blow up a balloon. It won’t take as much pressure to blow up a soft, new balloon as it would to blow up a stiff, old balloon.
Your diastolic pressure is measured during relaxation (between heartbeats). The anatomy of the resistance is thought to be slightly different. Diastolic relates to the stiffening of smaller vessels rather than larger vessels. This process can be influenced by stress, alcohol, extra body weight, as well as excess hormone levels of thyroid, cortisol, aldosterone, norepinephrine, and epinephrine.
Whereas systolic and mixed high blood pressure become more common with age, isolated diastolic occurs more often in people under 50 years old.
How to Lower Diastolic Blood Pressure
We consider “high blood pressure” as systolic greater than 130 and diastolic greater than 80.
Often, both systolic and diastolic measurements are elevated. Frequently, only the systolic measurement is elevated, particularly in the elderly. The majority of the time in these cases we cannot identify a particular cause of the elevated blood pressure and treat with medication to lower the blood pressure.
It’s much rarer for someone to have normal systolic but elevated diastolic blood pressure. Isolated diastolic hypertension affects an estimated 6.5% of the U.S. population. However, these cases are more often associated with disease states such as hormonal imbalances that need to be identified and treated rather than just using a medication to lower the blood pressure.
With a doctor’s help, you can lower high diastolic blood pressure by identifying an underlying condition in addition to lifestyle changes and medication.
Today’s Takeaways
Approximately 48.1% of adults in the U.S. have high blood pressure. While extremely common, elevated blood pressure can be dangerous and worsen if left untreated. Please take it seriously.
In the relatively rare event you have isolated diastolic hypertension — a different form of blood pressure — you will need more investigation by your physician to detect and treat an underlying cause, rather than merely taking high blood pressure medication.
But if you’ve been wondering how to lower diastolic blood pressure because yours is too high, it’s time to talk to your doctor.
What Is Non-HDL Cholesterol? Understanding Your Heart Health
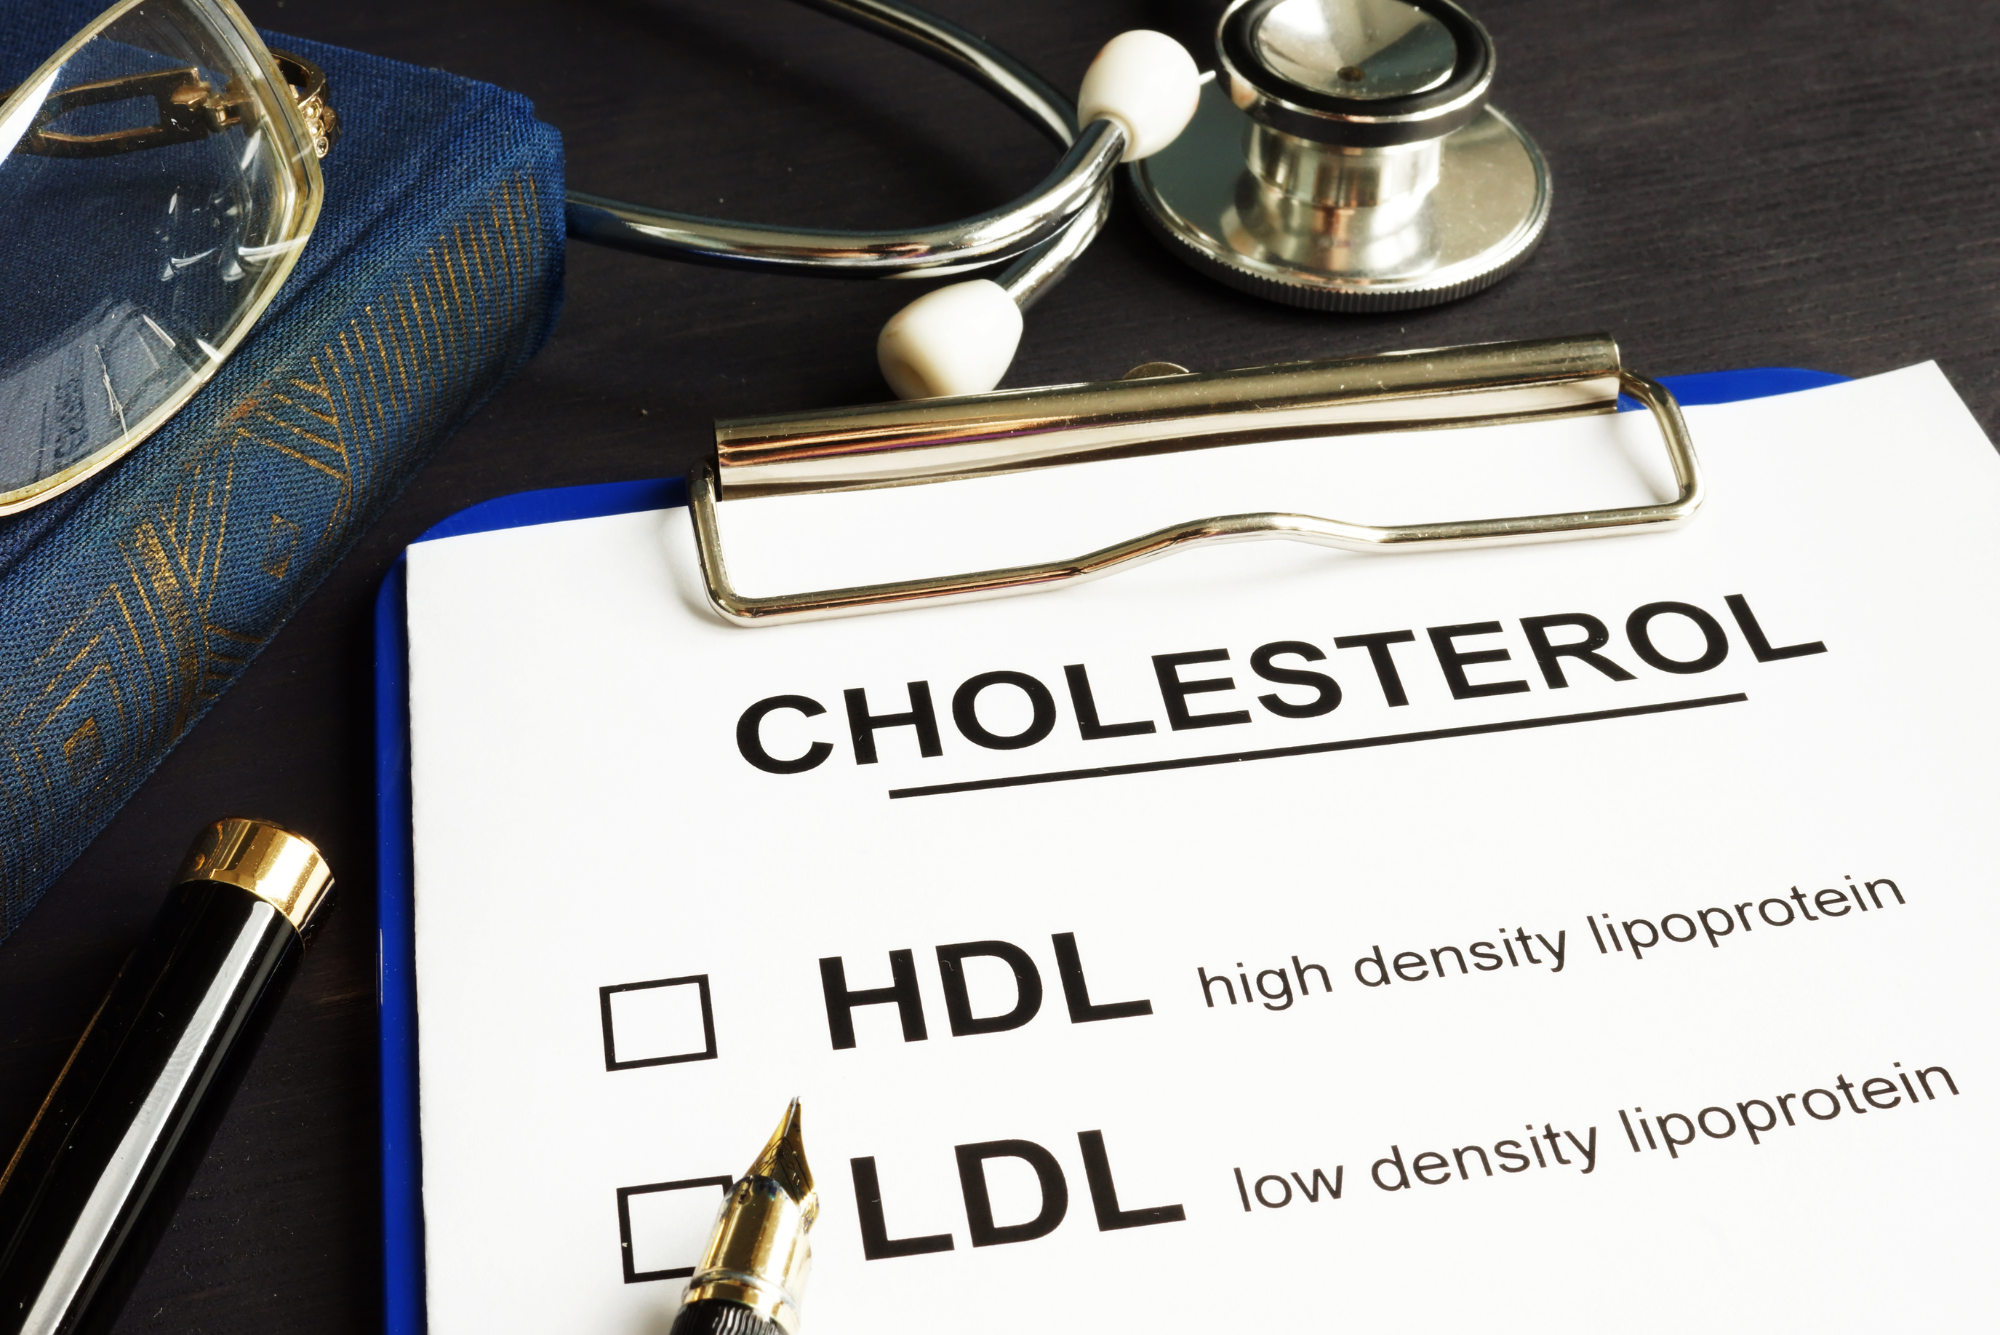
When doctors order traditional lipid panels as part of annual blood tests, patients see “non-HDL” and often ask, “What is non-HDL cholesterol?”
The question reminds me of reading Shakespeare’s “King Henry IV” in high school.
In the play, the character Prince Hal has five different names. This confused me until I realized all those names refer to the same person. Once I understood that, the play and plot became clearer.
The terminology used in medicine influences our comprehension and treatment options. Non-HDL is one of the least understood characters in the cholesterol metabolism “play.”
Blood Is Like “Oil and Water”
Our blood isn’t a homogenous liquid. It’s more like an oil and vinegar salad dressing. In this example, the water component of our blood is the “vinegar,” and the fat is analogous to the oil.

Fat doesn’t dissolve in water. Therefore, the fat forms little protein- and phospholipid-covered balls suspended in the blood.
Cholesterol’s Purpose and “Cast of Characters”
There’s no such thing as “good” cholesterol or “bad” cholesterol. A cholesterol molecule is exactly the same whether it’s contained in a “good” HDL particle or a “bad” LDL particle. We need cholesterol to build cell walls, manufacture hormones such as testosterone, and make bile acids to digest our food. Too much cholesterol in the wrong place, such as the walls of our arteries, confers its “badness.”
Understanding the “characters” that comprise the “play” of cholesterol metabolism is helpful.
“Main Characters”
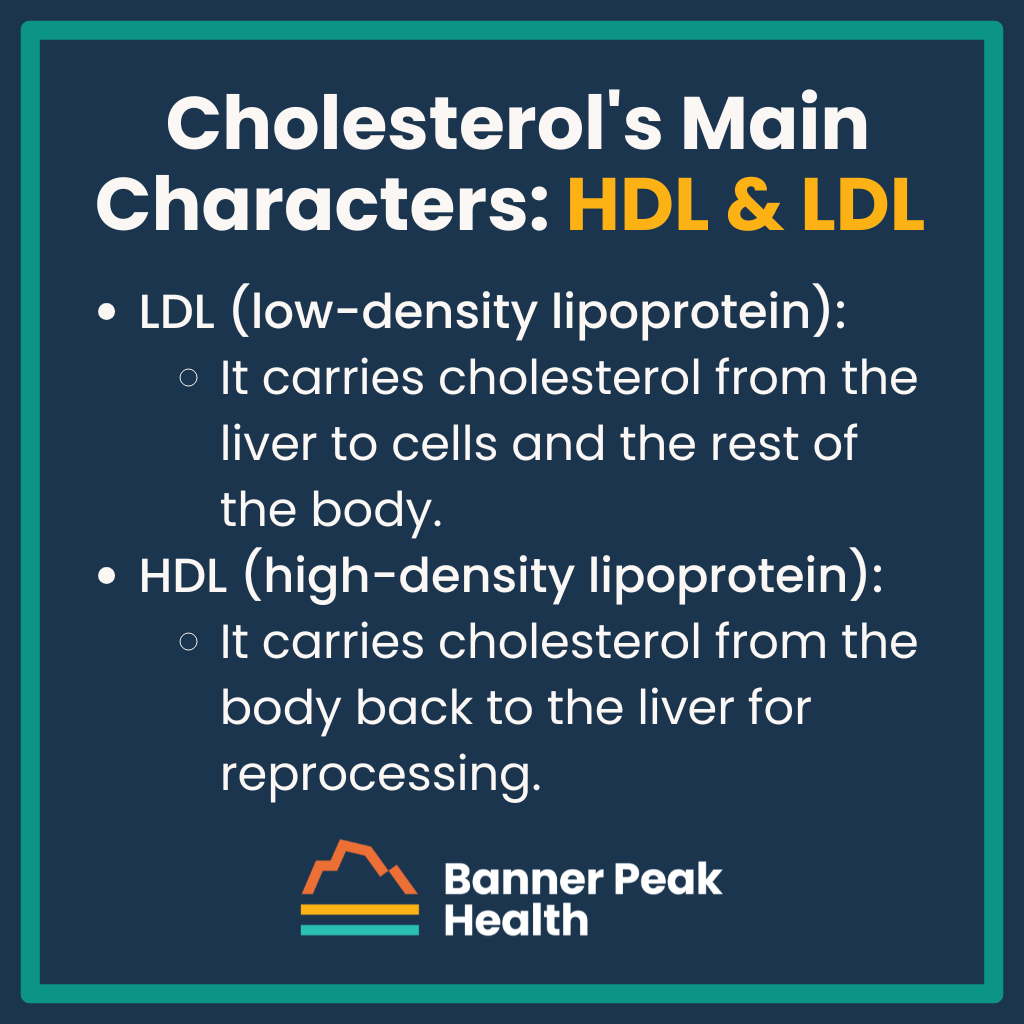
HDL and LDL are the “main characters” featured in cholesterol. You’ll see them on your lipid panels.
- LDL (low-density lipoprotein):
- It carries cholesterol from the liver to cells and the rest of the body.
- It can carry excess cholesterol to arterial walls to create dangerous buildup.
- HDL (high-density lipoprotein):
- It carries cholesterol from the body back to the liver for reprocessing.
- It reduces the amount of cholesterol deposited on arterial walls, where it can cause damage.
“Supporting Characters”
The following are some “supporting characters” to help you better understand cholesterol.
- VLDL (very low-density lipoprotein):
- It primarily contains triglycerides and very small amounts of cholesterol.
- VLDL transports triglycerides from the liver out to the body.
- Your body uses these triglycerides for immediate energy in muscles or energy storage in fat cells.
- IDL (intermediate density lipoprotein):
- As a VLDL particle delivers its triglycerides, it becomes proportionally richer in cholesterol and becomes an IDL particle.
- Chylomicron (ultra-low-density lipoprotein):
- It’s primarily a triglyceride-containing particle that transports fat from the gut to the blood.
What Is Non-HDL Cholesterol?
Non-HDL cholesterol is your total cholesterol minus HDL cholesterol. In other words, non-HDL cholesterol is the sum of LDL, VLDL, IDL, and chylomicron.
Why Measure Non-HDL?
Non-HDL cholesterol is easy, cheap, and convenient to measure. It’s a better predictor of coronary artery disease risk than LDL alone — especially when LDL isn’t elevated.
The Crucial Role of Lipoprotein B-100
Returning to the oil and water analogy, you might imagine a chaotic mix of tiny balls floating through your bloodstream. However, that’s not the case.
Each ball has a set of lipoprotein markers that identify its contents and the route it must take through the body to arrive at its designated location. Think of it like a passport.
A single lipoprotein called B-100 (“APOB”) occurs on each non-HDL particle.
Why is it important?
All non-HDL particles confer risk because they contain cholesterol, and blood vessel walls can absorb them. This means non-HDL cholesterol is potentially atherosclerotic and can contribute to cardiac disease.
Today’s Takeaways
Gaining a better understanding of lipid physiology and your lipid panel is beneficial for reading lab results and becoming more informed. This way, you won’t need to ask, “What is non-HDL cholesterol?”
Banner Peak Health employs non-HDL (or APOB) because it’s the most accurate risk assessment tool. The more accurately we can gain insight into your atherosclerotic risk, the more accurately we can target and mitigate that risk. Maintaining and improving your health is always our priority.
Is It Dangerous to Sleep With a Blocked Nose?
I recently had COVID-19 for the second time. Fortunately, it was mild with minimal cold symptoms: only a stuffy nose and dry cough.
However, I was really tired and “not myself.” Others describe similar sensations and describe it as “COVID brain” or “brain fog.”
Unfortunately, COVID can involve the brain, but I don’t think that was why I felt so fatigued.
Most nights, I wear a SleepImage ring and track my sleep. I suffer from mild obstructive sleep apnea that I treat with nasal dilators and nasal glucocorticoid spray.
Usually, I keep my apnea-hypopnea index (AHI) in the mild range. With COVID, I noticed my AHI rose sharply by 33%.
What happened? I experienced the deleterious effects of nasal obstruction on sleep quality.
Our sleep and overall health depend on how freely we breathe through our noses during sleep. Restorative sleep relies on nasal breathing, which offers numerous advantages over mouth breathing, including improved sleep.
That said, is it dangerous to sleep with a blocked nose?
Health Benefits of Nasal Breathing
Your nose acts as an air filter, catching dust and allergens before they go deeper into your body. It also helps condition and humidify the air before it reaches your lungs.
Breathing through your nose also oxygenates your blood more effectively. The air passing through your nasal passages produces nitric oxide, a vasodilator that improves oxygen circulation.
Another positive response is that the parasympathetic nervous system responds to nasal breathing by lowering blood pressure and heart rate.
Unfortunately, your body misses these benefits when your nose is blocked.
Challenges Associated With a Blocked Nose
Upper respiratory infections can cause nasal congestion, such as colds, COVID, and chronic conditions like allergic rhinitis (hay fever).
Breathing through your mouth long-term can lead to serious complications. For example, your saliva contains antibodies. If your mouth dries out as you breathe, you’re at risk for dental caries and infections.
Bacterial sinus infections and anatomical blockages, like a deviated septum and nasal polyps, can also cause nasal blockages.
Whatever the cause, these blockages cause common symptoms, including:
- Snoring
- Hypopnea
- Apnea
When these symptoms happen simultaneously and your upper airway collapses, it results in obstructive sleep-disordered breathing.
Poor Sleep Quality
When we’re sick, we often feel fatigued. Our first instinct is to attribute the tiredness to the illness’s direct effects.
However, much of that fatigue may be from sleep disruption. The inability to breathe through our noses and rest effectively causes disrupted sleep.
How to Reduce Fatigue and Sleep Better With a Blocked Nose
If you take a sick day, use the opportunity to nap. Napping has many benefits, especially when you’re not well. Increasing your sleep helps boost your immune system so you can recover faster.
Another way to reduce fatigue is to open nasal passages.
Using the diagram below, let’s consider the anatomy susceptible to swelling and blockage.

The area labeled “runny nose” is the nares (i.e., nostrils). Beyond is a labyrinth of tissue called turbinates (the two pink folds between “runny nose” and “post-nasal drip”), which swell and secrete mucus when infected or inflamed, causing obstruction and nasal congestion.
Solutions for a Blocked Nose
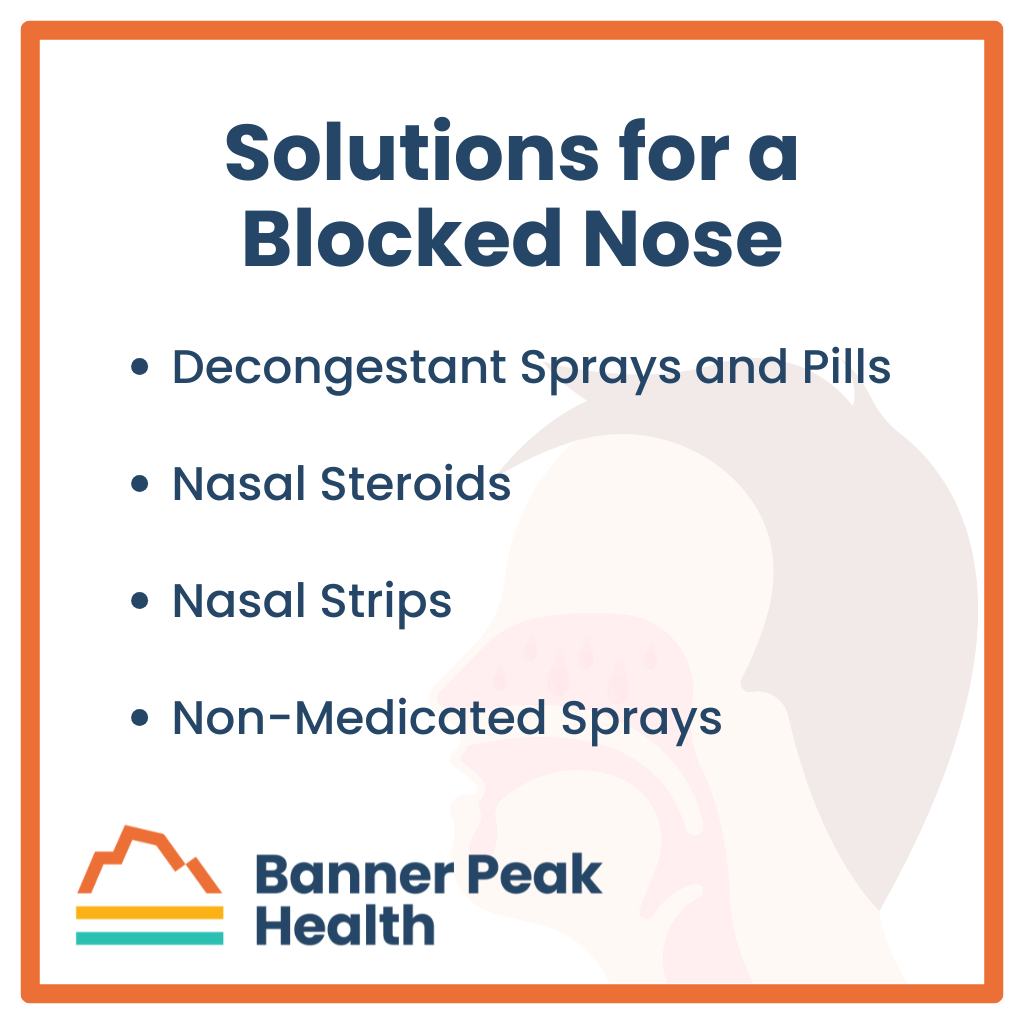
Here are some common medication and non-medication solutions for a congested nose.
Decongestant Sprays and Pills
Decongestants (e.g., Afrin, Sudafed PE, etc.) help constrict blood vessels in the mucosa, reducing its thickness and opening up blocked nasal passages.
However, these also have a stimulant effect. To reduce fatigue caused by sleep deprivation, use this class of medications cautiously. For some people, they cause insomnia.
Nasal Steroids
Use nasal steroids (e.g., Flonase Sensimist and Nasacort) for viral upper respiratory infections, COVID-19, and allergic rhinitis. They’re available over-the-counter without a prescription.
Nasal steroids are glucocorticoids, which, when absorbed into your body in higher doses, can have significant side effects. However, the spray is a fine mist that the body doesn’t absorb appreciably; it remains almost entirely in the nose.
There, it shrinks the mucosa and reduces nasal secretions. The best time to use a nasal steroid is immediately after a shower when the steam has opened your nasal passages.
Nasal Strips
Nasal strips (e.g., Breathe Right) physically dilate the frontal nasal passages. However, nasal obstruction occurs deeper in the turbinates, which are beyond the reach of nasal strips.
So, while the nasal strips may offer some relief, it’ll be minimal.
Non-Medicated Sprays
Non-medicated sprays (e.g., nasal saline and Neti Pots) are effective for allergic rhinitis because they flush the total amount of antigen that adheres to the nose’s lining.
Reducing the amount of antigens reduces the signal to your body, which inflames the nasal passages and creates mucus. Improving air filtration in your home reduces the number of airborne allergens that reach your nose.
These solutions don’t help with viral infections (e.g., colds and COVID) because the viruses infect the cells that line your nasal passage and can’t be rinsed away.
Today’s Takeaways
So, is it dangerous to sleep with a blocked nose? Well, it’s best to avoid it if possible. We all get upper respiratory infections occasionally, and despite our best efforts, we suffer from temporary nasal obstruction and become mouth breathers.
However, sleeping with an obstructed nasal passage long-term can lead to significant health and quality of life issues.
If you suffer from nasal obstruction often, address the underlying causes to improve symptoms like fatigue. If you need help diagnosing and treating breathing issues, contact Banner Peak Health.
Normal Oxygen Saturation by Age: Measuring and Monitoring
We all want to know we’re healthy and aging well. But what does oxygen saturation tell us about our health? What is oxygen saturation? Is there a normal oxygen saturation by age? Is it a good metric to track and gauge our health against?
Pulse oximetry is a tool worth understanding, and it’s essential to only use it in conjunction with qualified healthcare.
What Is Oxygen Saturation?
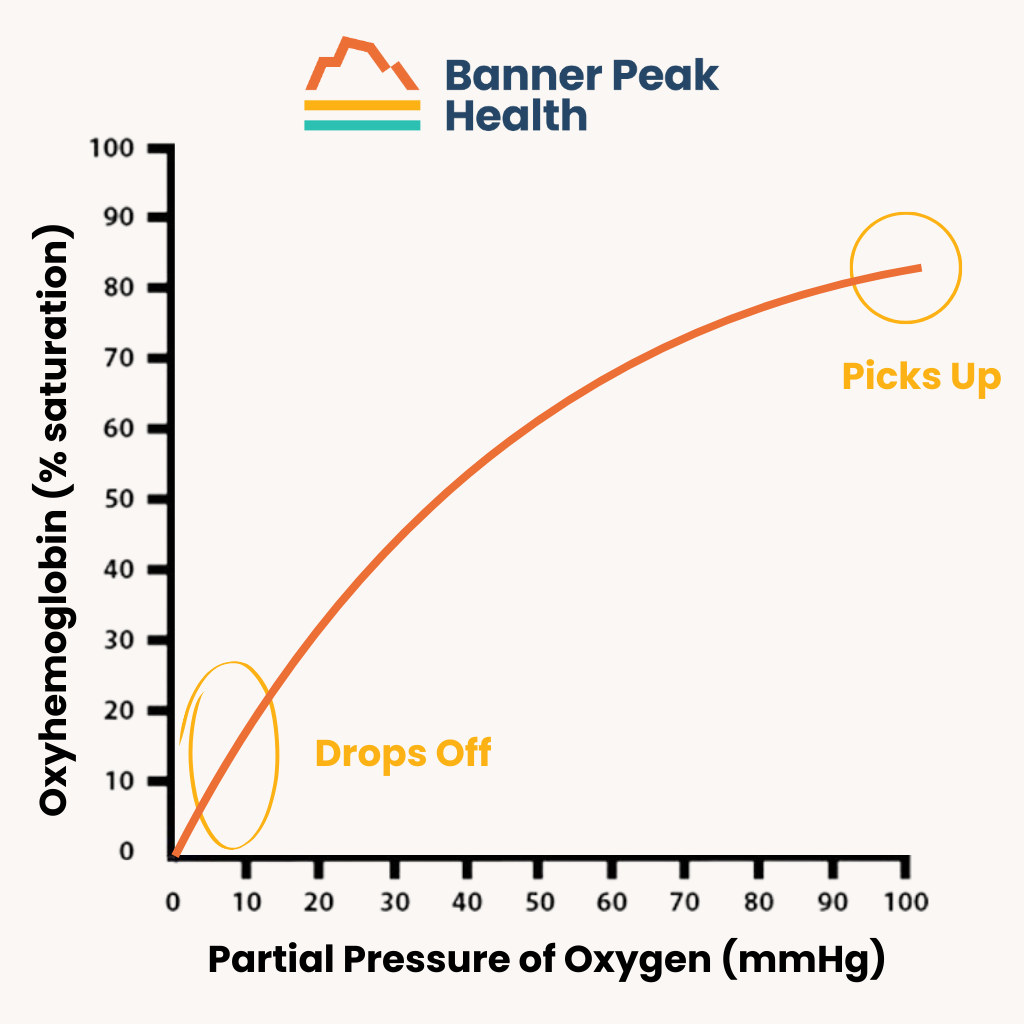
Our metabolism uses oxygen, which makes up 21% of our air, to produce energy. Oxygen saturation is the percentage of oxygen bound to the hemoglobin (a protein in red blood cells) in our blood.
However, the process is complicated.
Imagine a city (the body) where various construction sites (tissues) need lumber (oxygen) to function. Trucks (hemoglobin) go to the lumberyard (lungs) to pick up their cargo. They follow this system:
- Trucks (hemoglobin) arrive at the lumberyard (lungs) empty.
- Workers (alveoli: tiny air sacs in the lungs) load lumber (oxygen) onto the trucks.
- Each truck can carry four pieces of lumber (each hemoglobin binds four oxygen molecules).
- Fully loaded trucks leave the lumberyard (lungs) and enter the highway system (bloodstream).
- The highway has a central hub (the heart) directing traffic to different parts of the city (body).
- Trucks (hemoglobin) travel along various roads (blood vessels) to reach construction sites (tissues).
- The trucks (hemoglobin) turn bright red when loaded with lumber (oxygen).
- At each site, workers unload (release) the needed lumber (oxygen) for use (absorption into cells).
- Empty trucks return to the lumberyard (lungs) to pick up more cargo (hemoglobin returns to the lungs).
- When empty or carrying less lumber (oxygen), the trucks (hemoglobin) appear darker, with a bluish tint.
This cycle continues, ensuring a constant lumber (oxygen) supply to all construction sites (tissues) in the city (body).
How to Measure Oxygen Saturation
We measure oxygen saturation in two ways: blood testing and pulse oximetry. While drawing arterial blood for lab tests is accurate, it’s painful and inconvenient.
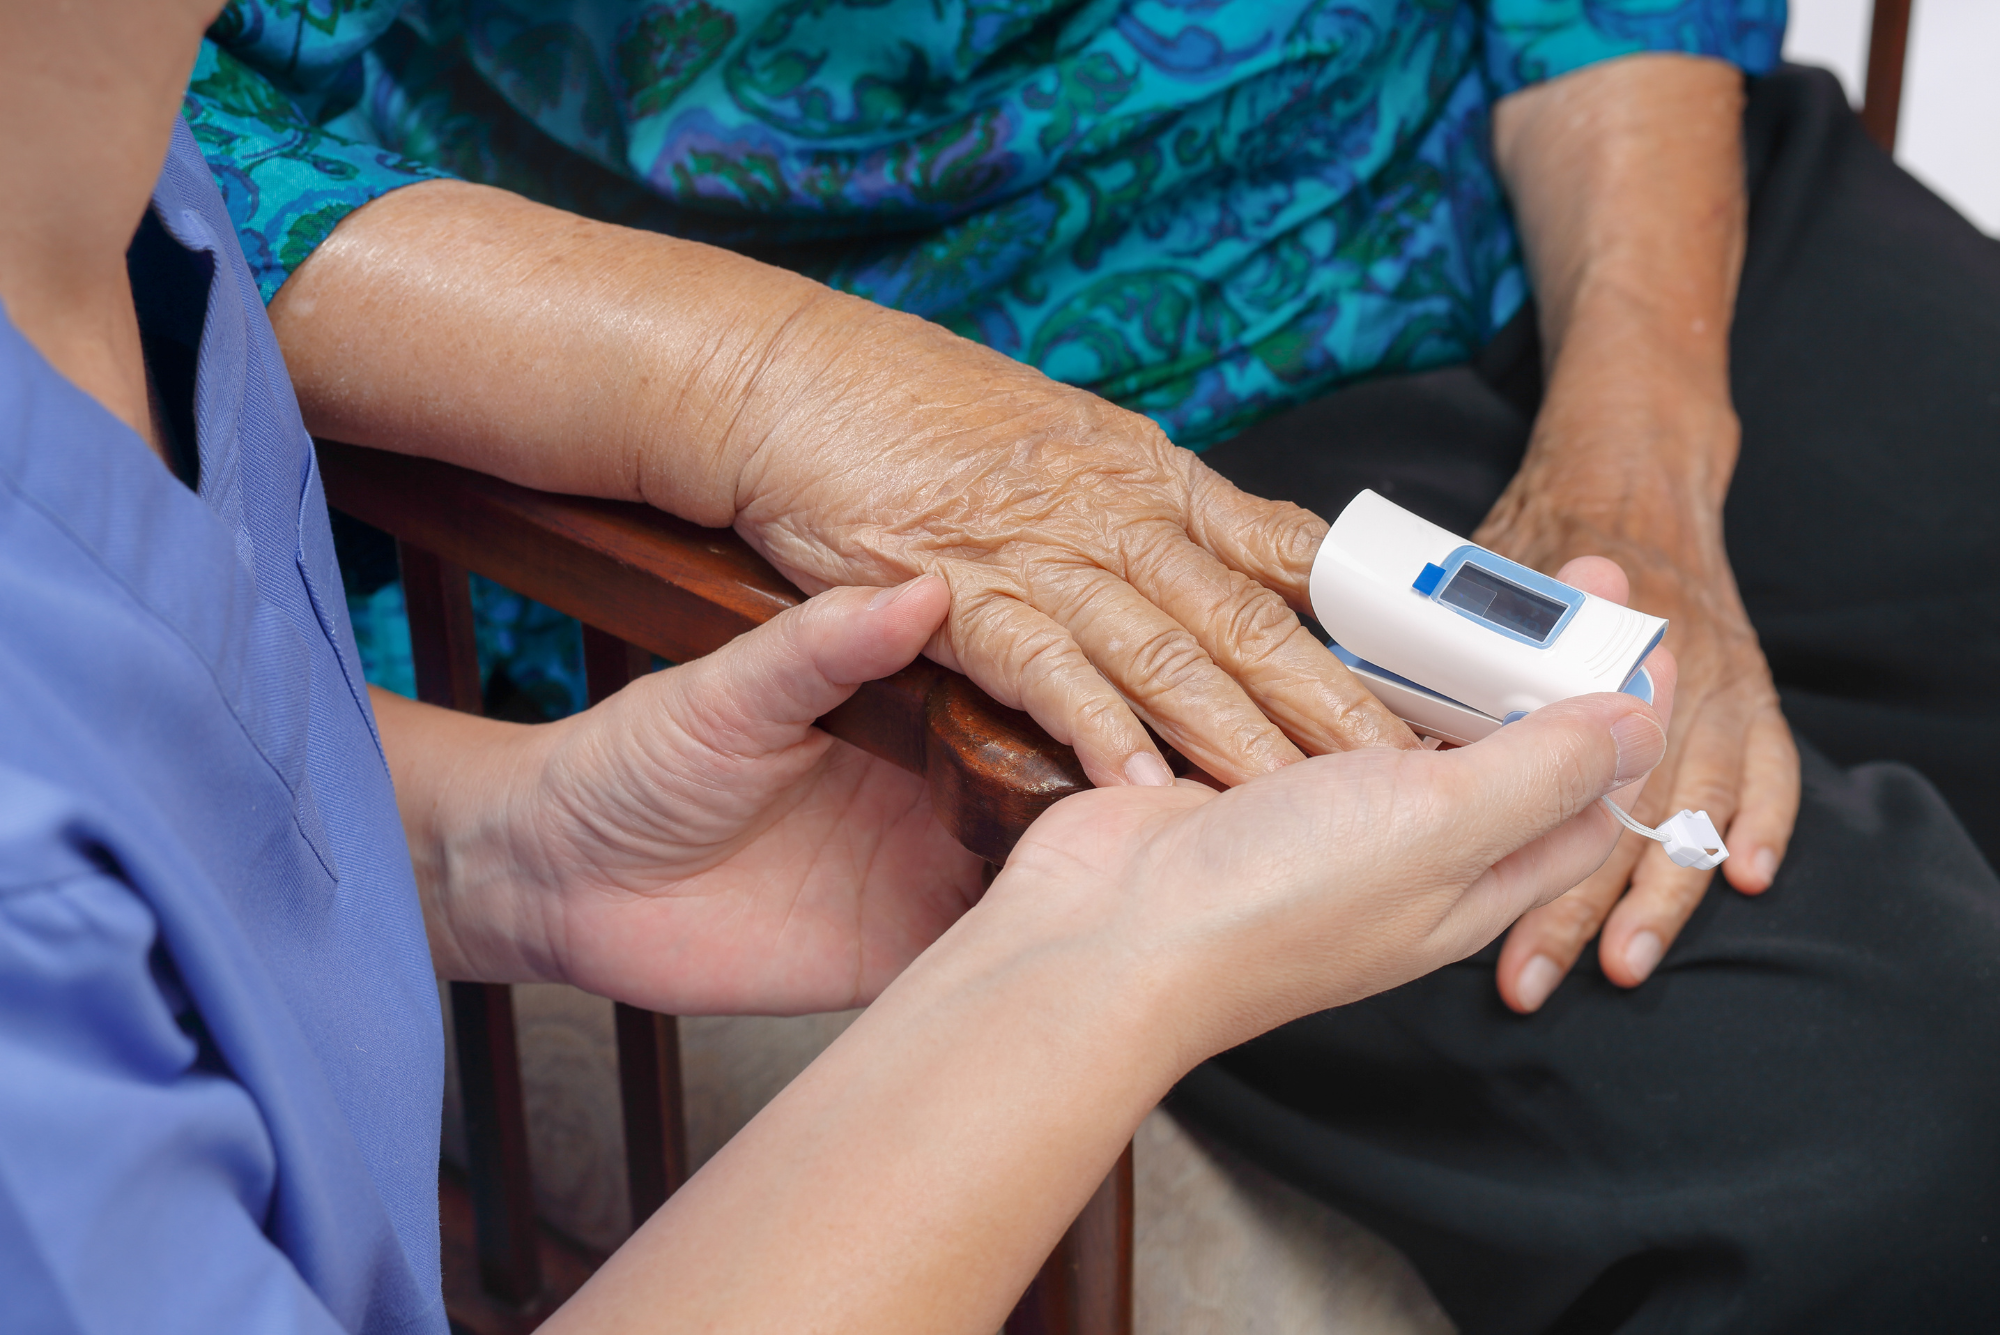
Pulse oximetry is non-invasive. It measures the color change of the hemoglobin to determine oxygen saturation. Blood with ample oxygen is reddish, while blood with depleted oxygen is more purple. Additionally, it measures your pulse rate — the quantity of hemoglobin that moves through your skin every time your heart contracts.
How Accurate Are Pulse Oximeters?
Source: Mockup Graphics via Unsplash
Pulse oximeters come in medical and over-the-counter (OTC) grades.
We don’t know the accuracy of OTC-grade devices because they aren’t FDA-approved. FDA medical-grade pulse oximeters are more accurate (±2–4% for oxygen saturation in the 90–100% saturation range). However, these devices become less accurate when oxygen saturation falls below 90%.
In addition to the inherent error source from the devices themselves, common use errors include:
- Too much ambient light
- Inadequate wait time between measurements
- Insufficient perfusion
- A cold finger or poor finger placement
- Nail polish on the measured finger
A pulse oximeter’s ability to detect the color of hemoglobin can be influenced by skin color. Darker skin containing more melanin absorbs more light and can produce falsely high readings.
An example occurred during the pandemic when many relied on pulse oximeters to triage medical emergencies. Tragically, people with darker skin were less likely to have their low oxygen levels show up on pulse oximeters.
As a result, during the height of the pandemic, this demographic probably suffered during triage decisions in the Emergency Department, being sent home when their true oxygen levels were lower than displayed on a pulse oximeter. This was an inexcusable ethical lapse by the medical community.
Use Cases for Pulse Oximeters
The best use case for this device isn’t a single measurement, but looking at an individual’s changes over time.
During the pandemic, we gave anyone who tested positive for COVID an OTC pulse oximeter and instructed them to monitor their oxygen saturation. Rather than looking for “normal oxygen saturation by age,” we looked for change in individuals.
For example, if a person’s pulse oxygenation looked like this: 94, 94, 94, 89 — we knew we had a problem.
Now, we recommend these devices for a very narrow set of conditions. When a member has a lung infection or lung impairment, such as an emphysema flare, pneumonia, or severe COVID, we use a pulse oximeter to monitor the illness over time, trying to detect a worsening.
Is There a Normal Oxygen Saturation by Age?
Technically, yes, there are age-related changes to oxygen saturation. Children, young adults, and middle-aged people usually have between 97% and 100% oxygen saturation. Once a person reaches 70 or older, their number will be closer to 93–97%.
However, as mentioned, even the higher-quality FDA-approved pulse oximeters are only accurate to ±2–4%. Any difference due to aging is less than the device’s accuracy. So, you can’t accurately measure change due to aging by measuring a single person.
Today’s Takeaways
Pulse oximeters are an important technology, but they’re only helpful for monitoring individual changes over time.
They’re prone to inaccuracy and are often used incorrectly. The device can create more anxiety than it alleviates. It’s not a valuable instrument at home, independent of consulting a doctor.
If you’re concerned about your oxygen saturation compared to the normal oxygen saturation by age, visit your healthcare physician and use a pulse oximeter in conjunction with their advice.

Outperform: The Leading Edge of Banner Peak Health
Seventeen years ago, I left a large medical group to launch my concierge medical practice. I wanted to work for my patients, not insurance companies.
The new financial model of care allowed me to preserve the core principles of Internal Medicine:
- Commitment to prevention
- Thorough evaluations
- Long-term relationships with patients
- Intellectual depth in problem-solving
- Enthusiasm for medicine
As a concierge doctor, I felt like an endangered species surviving in a protected enclave that escaped the habitat destruction insurance-based medicine wrought. The demand for this level of care continues to grow, far exceeding my capacity.
Creating Banner Peak Health and partnering with stellar doctors has allowed me to expand the number of patients who benefit from old-fashioned, state-of-the-art Internal Medicine.
Over the last few years, I’ve realized that patient-funded care preserves high-quality Internal Medicine and provides the foundation for incorporating new technology and techniques into our practice.
I’ve written about the concept of “diagnostic deserts.” Numerous medical diagnoses exist for which there are no lucrative drug or surgical treatments and, hence, are not adequately addressed in traditional medicine.
Unfortunately, these are not rare conditions. For example, anyone with insomnia, chronic pain, or menopausal symptoms has most likely experienced this issue. Fortunately, concierge medicine creates a new opportunity for more healthcare options.
Going Beyond Concierge Medicine to Outperform
I’ve dedicated the next phase of my career to identifying, learning about, and implementing new medical approaches for patients at Banner Peak Health. The rapid development of new technology and the clinic’s financial structure have made this innovation possible. There are no diagnostic deserts in concierge medicine.
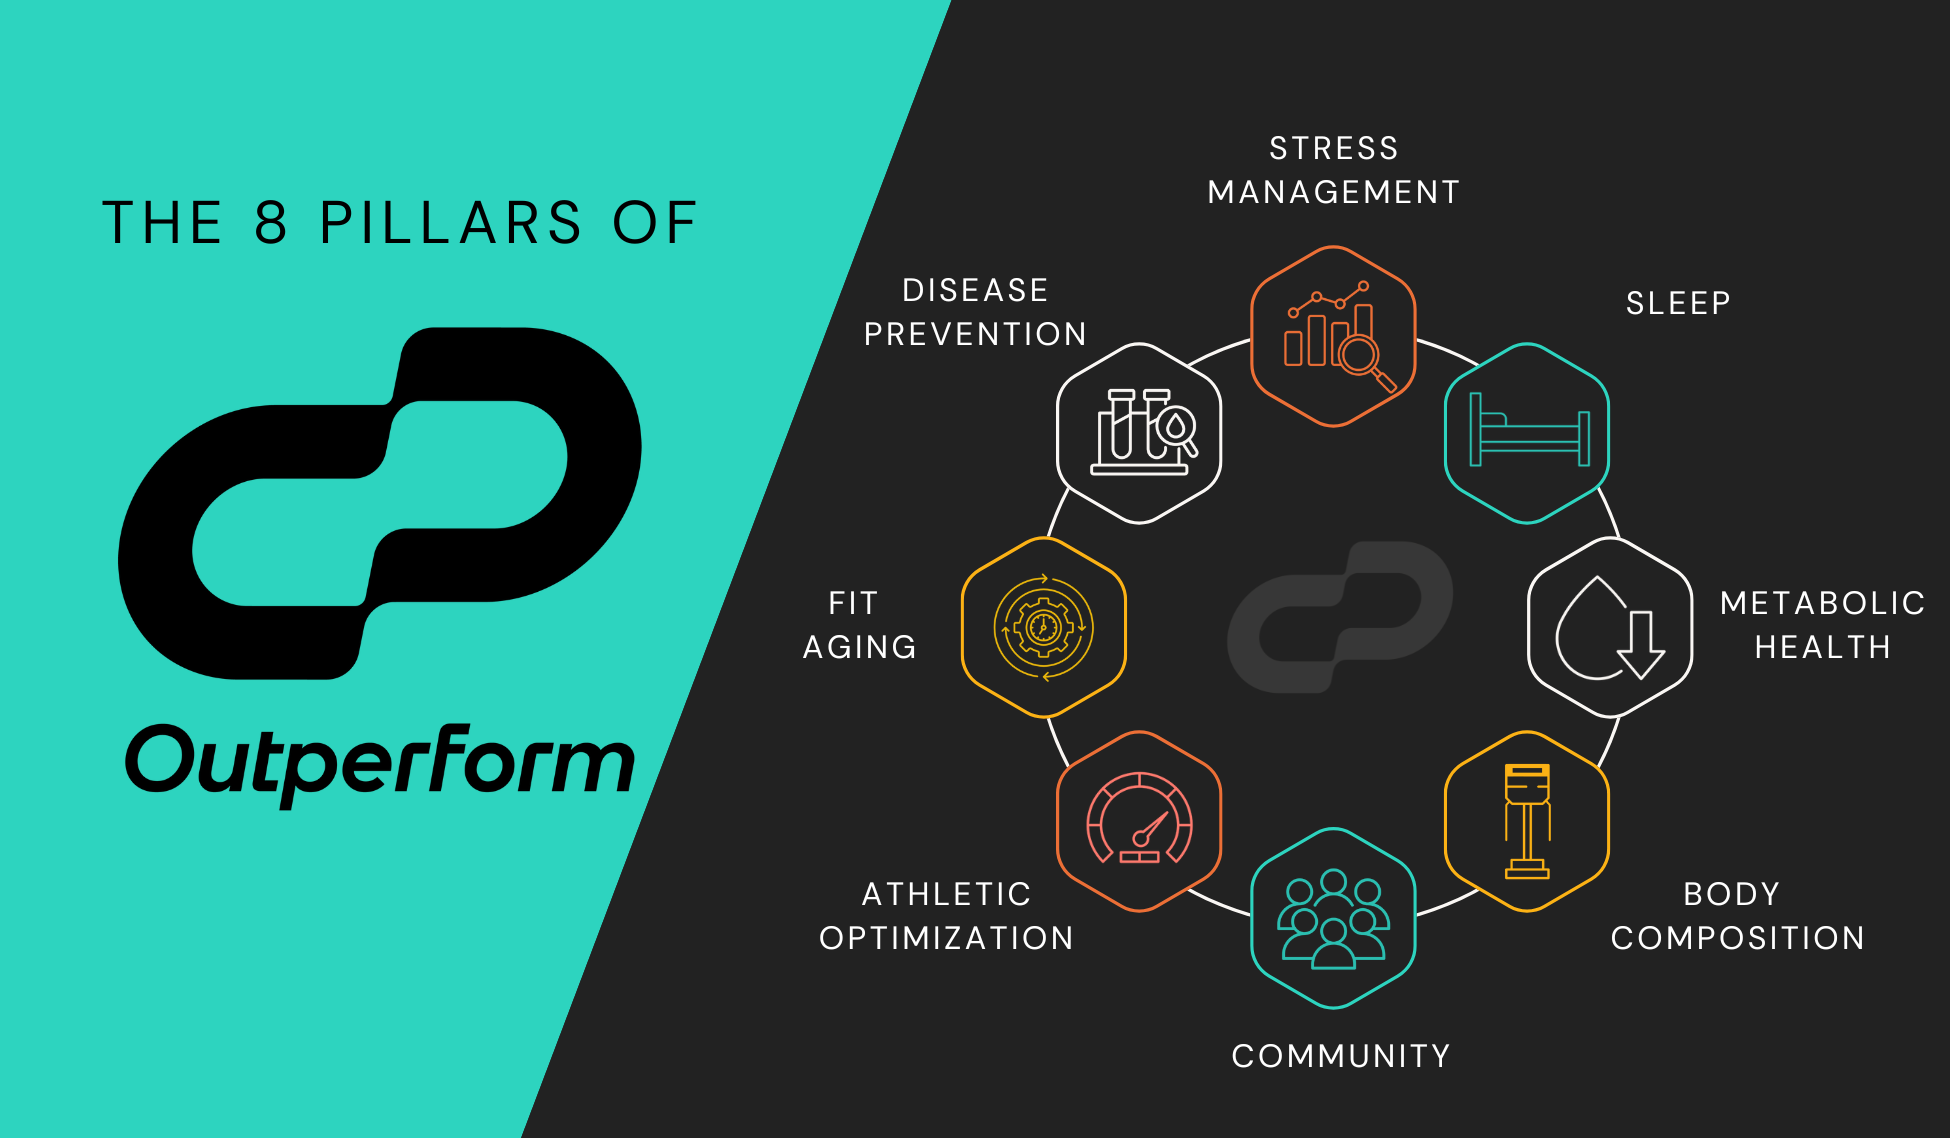
That’s why I’m introducing the Outperform program — to enable Banner Beak Health patients to take the next step and go beyond conventional medicine. We’ll help our members achieve optimal performance in eight key areas:
- Stress management
- Sleep
- Metabolic health
- Body composition
- Community
- Disease prevention
- Athletic optimization
- Fit Aging
The Eight Pillars of Outperform
The following discusses the innovations we’re developing in the eight categories:
1) Stress Management
Everyone agrees that excessive chronic stress is bad for your health. Most of us are very aware of what causes stress in our lives. Until now, we lacked a means of quantifying our stress. It’s been said, “You can’t manage what you can’t measure.”
Prior blog posts have emphasized the value of metric-driven empowerment cycles (MDECs). By measuring a health outcome, you enable efforts to determine the best interventions to improve it.
Recent wearable devices, such as the Oura ring, have allowed accurate and convenient determination of heart rate variability (HRV), which provides a quantitation of how our bodies react to stress.
By recording daily HRV values, you can analyze the effects of the myriad factors that influence stress, such as alcohol, meditation, sugar ingestion, exercise, sleep, and more. HRV analysis is a novel and unique stress management tool.
2) Sleep
Adequate quality and quantity of sleep is the bedrock of physical and emotional well-being — a statement anyone suffering from sleep impairment intuitively understands.
Fortunately, we’re amid a sleep medicine revolution, driven by the advent of inexpensive, convenient, and accurate home sleep testing. What once required 22 wires and an overnight stay in a sleep lab can now be accomplished by wearing a rubber ring — SleepImage device — that communicates with your smartphone and which you can wear at home nightly.
We partner with Empower Sleep, a telehealth sleep medicine clinic, to offer a one-month home sleep Discovery Program. This allows us to diagnose previously unknown sleep impairments and assess the adequacy of treatment for known disorders like sleep apnea.
Unfortunately, obstructive sleep apnea (OSA) is a common disorder affecting at least 10% of adults. Most are unaware of their diagnosis. Of those diagnosed, 33% to over 50% can’t tolerate the first-line treatment, a continuous positive airway pressure (CPAP) device.
Using the SleepImage device and working with Empower Sleep, we can diagnose clinically important occult causes of sleep impairment. Also, by wearing the device nightly, we can use trial and error to try multiple lower-intensity treatments for mild-to-moderate OSA and find solutions instead of using a CPAP device.
3) Metabolic Health
About 98 million adults (or one in three) in the U.S. have prediabetes, according to the CDC. The vast majority are unaware that they have this serious risk factor for multiple other illnesses, such as stroke and heart attack.
At Banner Peak Health, we monitor for the earliest evidence of impairment in metabolic health, checking fasting glucose levels, insulin levels, hemoglobin A1c, and patterns in lipid levels that suggest prediabetes.
While the medical profession is responsible for diagnosing prediabetes, treatment requires committed effort by the individual. There’s no drug-based treatment. Reversing prediabetes requires reducing caloric intake, increasing energy expenditure, and possibly even modifying the bacteria in your digestive tract.
We use state-of-the-art tools to help individuals optimize their metabolic health. Everyone has unique blood sugar physiology, and regarding dietary advice, one size does not fit all. We assist patients in using continuous glucose monitors (CGMs) to record sugar levels in real time, allowing them to identify which foods and activities affect their blood sugar levels.
We’ve been among the first to recommend probiotics from the manufacturer Pendulum, such as Glucose Control, which is shown to lower blood glucose levels.
We’re developing protocols to use Zone 2 training to reprogram mitochondrial function to restore metabolic health.
4) Body Composition
Knowing your weight is important — so is knowing your body composition, or “what you’re made of.” Our bodies consist of muscle, fat, bones, connective tissue, organs, and fluid.
We now use InBody devices, which use bioelectrical impedance analysis to determine fat, muscle mass, and fluid mass. Each component has important health consequences.
We can usually infer excess body fat from a traditional scale. An InBody analysis provides insight into muscle mass, which we can’t determine from a traditional scale. As a result, we’ve made many startling discoveries.
Those with excess fat mass may also have substantial muscle mass (i.e., hidden athletes). More commonly, in older adults, we see sarcopenia (i.e., insufficient muscle mass). This hidden finding correlates with poorer health status during the aging process.
Having diagnosed sarcopenia, we can create a treatment program centered on increasing dietary protein intake and muscle-strengthening exercise programs. We can track progress over time using InBody measurements.
5) Community
Yes, community is a medical topic. Our current surgeon general, Dr. Vivek Murthy, launched a program addressing the loneliness epidemic in the U.S.
Loneliness has dire medical consequences. Conversely, studies of successful aging identify ample social connection as a key ingredient. How connected we are to others impacts our physical and emotional health.
I envision the Outperform program as an opportunity to build a community around the shared goal of prevention. In medicine 2.0, the disease treatment model, care most often involves an individual in a room with a doctor.
But is that the best structure for medicine 3.0, prevention-based medicine? Many prevention-based endeavors are social, such as eating, exercising, learning, and relaxing. Why not create a program of shared activities to enhance health?
In 2025, the Outperform program will include activities to enhance physical and emotional well-being. Patient interest will determine the final set of offerings.
We’re considering yoga, meditation, Pilates, rucking (hiking with a backpack), walking, and biking. Please contact us and tell us what group health activity you’d sign up for.
6) Disease Prevention
What if the best dishes aren’t on the menu?
Unfortunately, insurance funding for preventative medicine often lags years or decades beyond the development of new medical technology.
Banner Peak Health isn’t constrained by insurance reimbursement. We can implement the most up-to-date and effective techniques to keep you well.
Most people know that their cholesterol levels relate to their risk of coronary artery disease. This connection comes from our understanding of epidemiological studies evaluating large numbers of people and linking risk factors, such as elevated cholesterol, with bad outcomes, such as heart attacks.
Rather than relying only on statistical models, we now have technology to assess risk more accurately by examining an individual’s coronary artery anatomy, using low-dose CT scans to look for calcification associated with coronary artery atherosclerosis. We can refine a statistical estimate by imaging your own anatomy, leading to a more accurate understanding of your risk and better guiding treatment to reduce it.
Insurance covers basic cancer screening technologies that have existed for decades, such as Pap smears, mammograms, and prostate-specific antigen (PSA) blood tests. However, insurance doesn’t cover the Galleri cancer screening test. This revolutionary new test can detect over 50 types of cancer by identifying trace amounts of cancer DNA shed into the blood, a tenfold increase in the number of cancers we currently can detect by screening.
We recommend the Galleri cancer screening test in our patients over 50 years old or who have a family history of early cancer. We’ve diagnosed early cancer in patients that other means hadn’t detected.
7) Athletic Optimization
As mentioned, the funding source can dictate the content of healthcare offered. Sports medicine has evolved as a predominantly self-funded discipline, with athletes and teams paying for the latest technological advances.
Unfortunately, I’ve noticed distinct silos of information between sports medicine and Internal Medicine. I envision the Outperform program as a synthesis of the two.
For example, exercise — both aerobic and strength training — is the most effective treatment for reducing the risk of diabetes. Rather than non-specific advice to “get more exercise,” the Outperform program will allow us to create evidence-based, individualized training programs and measure their effectiveness.
Outperform will bring medical expertise to the challenge of maximizing recovery from workouts. Trick question: Does performing a running or weightlifting workout make you faster or stronger? The answer is no.
Workouts create a stimulus for your body. With adequate recovery, your body can respond to this stimulus and improve your level of function through improved cellular function.
Without adequate recovery, training stress can degrade your body rather than improve it. Thus, a workout alone doesn’t improve your fitness level.
Sports medicine advises on how to train. It tells you how many reps to do, how heavy the weights should be, and how long to rest between sets. However, it doesn’t give much advice about how to get the best recovery, especially when it comes to sleep.
Adequate quantity and quality of sleep is vital for optimal recovery. Hormones such as human growth hormone and testosterone are secreted naturally at night in proportion to how much we sleep.
The advice to “get more sleep” might be adequate for a younger athlete. But athletes in their 40s, 50s, and beyond often have trouble sleeping. Since sleep is necessary for optimal recovery, it’s essential that older athletes talk to their doctors if they have difficulty sleeping.
Athletic optimization requires a community of ancillary services working together. The Outperform program will include access to fitness instructors, nutritionists, coaches, and physical therapists to create a comprehensive program.
Over time, the Outperform program will expand to include sports physiology testing programs to provide state-of-the-art assessment for Zone 2 and VO2 max, enabling the targeting of training regimens.
8) Fit Aging
You’re never too old to benefit from exercise! In fact, the value may increase as we age.
Traditional healthcare emphasizes treating existing diseases such as high blood pressure and coronary artery disease.
Yes, avoiding complications from existing diseases is important. However, maximizing functional capacity remains paramount as we get older.
Can I lift a suitcase, walk to the park, lift a grandchild, avoid falls in the dark, stand in the shower, and perform a myriad of other tasks that define our lives? Unfortunately, traditional medicine woefully neglects this aspect of aging. Medications alone don’t allow us to vibrantly embrace life decade after decade.
At present, exercise is the closest we have to the mythical “fountain of youth.” Training your body accomplishes what no pill can.
The Outperform Fit Aging program begins with a structured assessment of your baseline status: your body composition, strength, agility, and balance. We then create a custom program incorporating nutritional advice, exercise classes, and fitness training.
Using a metric-driven empowerment cycle (MDEC), we can repeat your baseline measurements, hold you accountable, and track your progress. We’ll support your journey to enhancing and preserving your body’s functional capacity.
Today’s Takeaways
Outperform encompasses many new areas of growth for Banner Peak Health. We’ll integrate many aspects into clinic appointments at our current location; others will require more space and new equipment.
To that end, we’re opening an additional location across the street at 1575 Treat Blvd. It has the space for group classes, exercises, specialized testing equipment, and treatments. We’ll soon finalize the details regarding the techniques, tools, and equipment we’ll use and recommend.
We’ll have a new logo for Outperform and lots of fun swag to help establish our new brand of medicine.
Everyone’s welcome to join us on this innovation journey at Banner Peak Health.
How Long Does Melatonin Stay in Your System?
Can’t sleep? Do you finally get to sleep but can’t stay asleep? You’re not alone.
Millions of people experience sleep disruption, insomnia, or some form of sleep disorder. They take sleeping pills and supplements in the hopes of solving their sleepless nights, only to find themselves more exhausted.
What about melatonin? It’s all natural, right? It must be better than Benadryl! But how much should you take? And how long does melatonin stay in your system?
These are important questions to ask before taking any medication or supplement, and we’ve got the answers.
What Is Melatonin?
First discovered in 1958, melatonin is a hormone manufactured by a part of the brain called the pineal gland. Here’s how the process works:
- We have special non-image receptors in the back of our retinas that perceive light and darkness.
- As these receptors detect darkness, they send a signal to the brain region called the suprachiasmatic nucleus.
- The suprachiasmatic nucleus triggers the pineal gland to secrete melatonin.
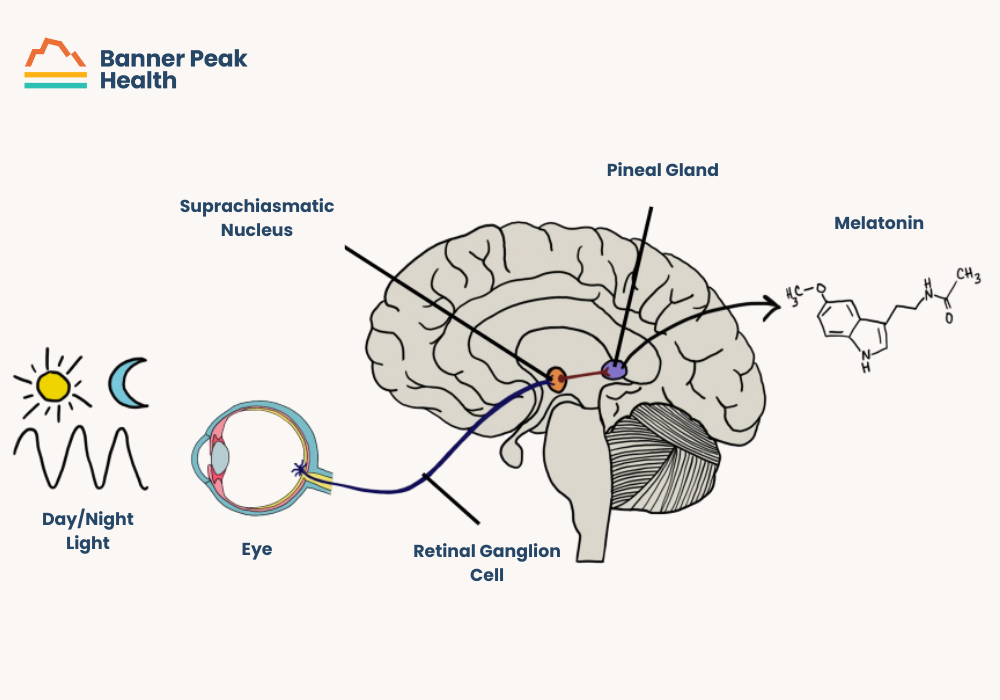
Melatonin is the “hormone of darkness.” It helps to synchronize our circadian rhythm (i.e., internal clock) with the light and darkness of the world around us.
Melatonin as a Supplement
Since melatonin is a crucial hormone for normal biological function, its use as a supplement has become popular in recent years for various reasons.
The global market value for melatonin supplements in 2022 was $2.15 billion, projected to increase to $8.64 billion by 2032.
The literature on the efficacy of melatonin supplements varies. Some studies show benefits, and others show none. The key component to consider is the root cause of insomnia.
For example, melatonin can be helpful for people with delayed sleep phase disorder (aka “night owls”) because it’s a circadian rhythm issue — tied to when your body makes melatonin.
If we think of your sleep as a house, we want to investigate the reasons for the cracks in the walls rather than simply painting over them.
Most prescription medications are like paint: They cover the cracks but don’t repair them. We want to find and fix the root cause of the damage.
Causes for insomnia can include medication side effects, unresolved pain, associated mental health challenges (e.g., anxiety, depression, PTSD), substances (e.g., nicotine, alcohol, caffeine), and more. A sleeping pill doesn’t address any of these.
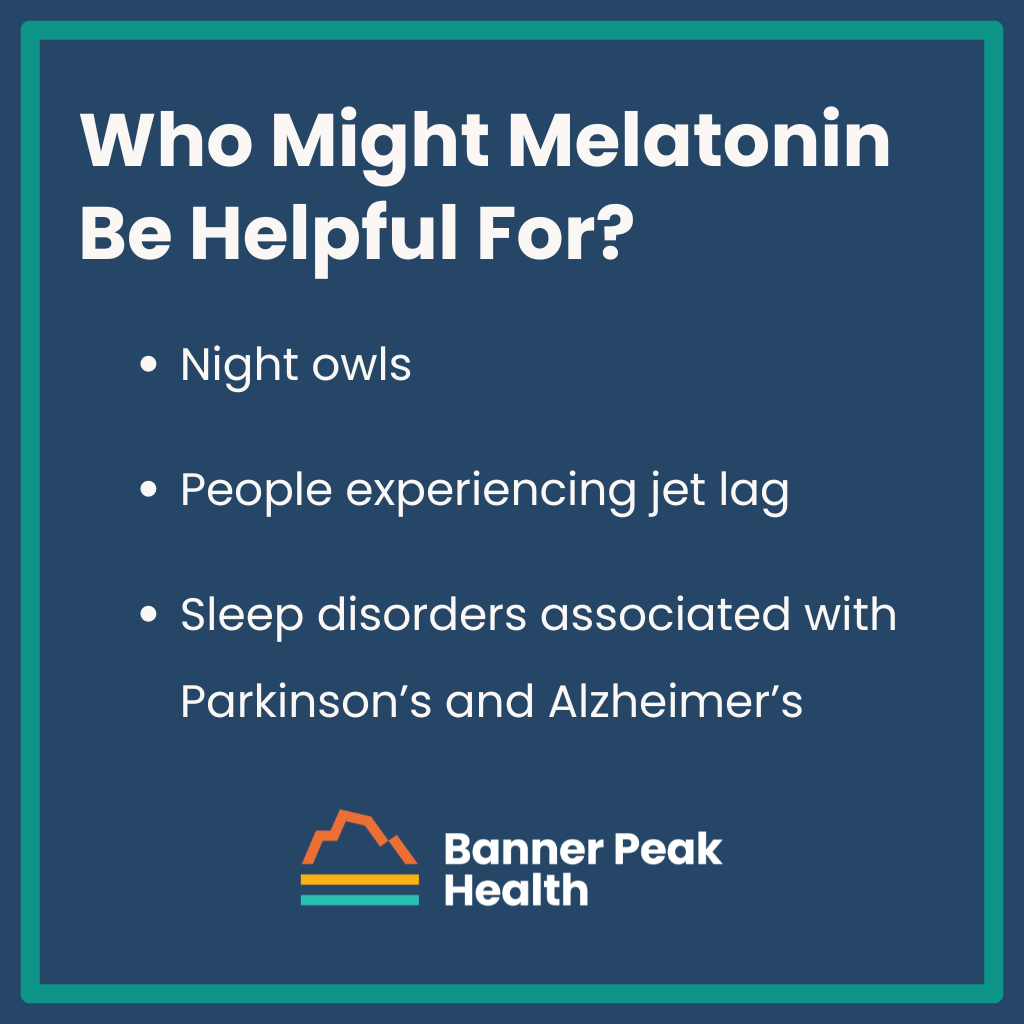
Who Might Melatonin Be Helpful For?
Since it’s a natural hormone, melatonin naturally affects our circadian rhythm, helping to correct circadian rhythm disorders.
Here are some examples of people for whom melatonin can be helpful:
- Night owls can use melatonin to adjust their sleep habits and improve insomnia.
- There is both individual and age-related variability among night owls. Teenagers are naturally night owls due to hormonal changes during that life stage.
- People experiencing jet lag can use melatonin to recover faster.
- Studies have shown that melatonin can improve sleep disorders associated with Parkinson’s and Alzheimer’s. Both have reduced melatonin production as a part of the disease.
What if You’re Not in One of Those Categories?
The literature supporting the use of melatonin supplements is slim. However, it’s a remarkably safe compound — much safer than prescription (e.g., Ambien or Lunesta) or OTC sleeping aids (e.g., Benadryl, aka diphenhydramine).
When we look at the risk vs. benefit ratio, the benefits far outweigh the risks. That said, there are some potential side effects to be aware of. These include:
- Daytime sleepiness
- Change of mood
- GI disturbance
- Nightmares
- Headache
- Dizziness
- Nausea
Remember that the FDA doesn’t regulate supplements. So, if you want to try melatonin as a supplement, be aware and informed.
A study from 2017 found that the content of melatonin measured in the products varied dramatically (between -83% to +478%) from the amount listed on the package labels.
How Long Does Melatonin Stay in Your System?
Like many medical questions, the answer to “How long does melatonin stay in your system?” is “It depends.”
According to one small study, melatonin remained in the subjects’ systems for an average of five hours. However, at higher doses (>50pg/ml), it took as many as 10 hours to leave the bloodstream completely. At 10 hours, the dose may extend into post-awakening hours and affect other activities.
However, as we mentioned, there are very few studies on melatonin, and this study, although controlled and randomized, had only 56 participants. We need more larger studies to learn definitive answers about melatonin and its effects and applications.
Melatonin Use Cases and Recommendations
Currently, the most common use cases for melatonin supplements are:
Delayed Phase Sleep Disorder
People with insomnia have a difficult time falling asleep. For them, we suggest an extended-release supplement four hours prior to the desired bedtime.
This mirrors the physiology of our endogenous hormone, melatonin, inducing sleep. It builds slowly over time and signals a natural bedtime.
Additionally, we recommend blue light-blocking glasses. This is because blue light signals our body to suppress melatonin. Tip: Blue light-blocking glasses must be amber-colored. If the lenses are clear, they aren’t strong enough to block all blue light.
We suggest wearing the glasses two hours before bedtime and not removing them until you close your eyes. People in this group include:
- Teens
- Night owls
- People with anxiety
- People with fibromyalgia
Preterminal Insomnia
These people wake up in the middle of the night and have trouble staying asleep. The best way to use melatonin to treat this form of insomnia is to absorb it as quickly as possible.
I recommend low-dose, 1mg lozenges — break one in half or quarters. You really only need a small fraction of the 1mg.
Keep the broken lozenges at your bedside so you can stay in darkness and relax until it kicks in. It may take up to 20 minutes, but the benefit is that it won’t cause daytime sedation. The people most often affected by preterminal insomnia are:
- People with anxiety
- People with jetlag
Melatonin Supplement Recommendations
For most people, less is more. We suggest a dose of between 600 micrograms (mcgs) and one milligram (mg) for most people taking a melatonin supplement. Patients with Parkinson’s or Alzheimer’s may benefit from a higher dosage, 5–10 mgs, to compensate for their bodies impaired ability to make melatonin.
We recommend these two brands* of melatonin supplements:
- Short-acting: Source Naturals Sleep Science® Melatonin
- Time-release: Life Extension Melatonin Six Hour Time Released Vegetarian, 300 MCG
*Not affiliated or sponsored
Since the literature on this topic comes up short, I base these recommendations on my decades of personal and professional experience.
Today’s Takeaways
- Before taking any sleep supplement or medication, determine the root cause of your sleep disorder.
- If you need a supplement to help with sleep, melatonin is safer than many alternatives.
- If you use melatonin, decide whether you need a fast-acting or slow-release formula. This depends on your use case.
- How long does melatonin stay in your system? It depends. The average is around five hours, but it can be up to 10, so tread carefully and remember that less is more.
If you have questions about melatonin or sleep medicine, reach out anytime. We’re here to help!
Heart Rate Variability Chart by Age: Are You in the Normal Range?
Many people want to know if their heart rate variability (HRV) is normal and how to improve it.
But what is heart rate variability? Is it wise to compare your heart rate variability to a heart rate variability chart by age?
Heart Rate Variability, the Autonomic Nervous System, and Our Health
Heart rate variability measures how the spacing between heartbeats varies with respiration.
The autonomic nervous system controls your heart rate and other automatic systems in your body, like breathing. This system includes the sympathetic (fight or flight) and parasympathetic (rest and digest) nervous systems.
The graphics below demonstrate how these systems work together to determine your HRV.
When you inhale (called inspiration), your sympathetic nervous system dominates slightly and your heart rate quickens a bit. When you exhale (called expiration), your parasympathetic nervous system dominates slightly and your heart rate slows a bit. Your heart rate variability is derived from the difference between these two lengths of time.

The lower the HRV, the more dominant the sympathetic nervous system.

When the sympathetic nervous system predominates, the body is having a harder time responding to stress. Someone with a lower heart rate variability may not handle stress well.
Conversely, increased parasympathetic variability reflects how well your body maintains homeostasis — how adaptable you are to external challenges.
It’s possible and beneficial to change how your body responds to the inevitable stressors of life:
- Improve your immune system before germs infect you.
- Enhance your endocrine system to rebalance your blood glucose.
- Strengthen and stabilize yourself before you fall and break your hip.
Life is about homeostasis, but stressors try to throw us off balance. Parasympathetic variability is a good marker of stress resilience.
How Does Age Affect Heart Rate Variability?
Age is a process of losing adaptability.
As we age, it’s harder to maintain homeostasis. Any middle-aged person who’s battled a cold for weeks while their toddling grandchild improves after just a few days can attest to that. Recovery takes longer.
HRV, which maps our adaptability, declines with age. The heart rate variability chart by age below demonstrates this:

What Can We Do About It?
In medicine, we ask a fundamental question: Is the decline in function because of an inherent, immutable aging process, or is it because of some reversible cause? Is it inevitable? Can we fix it?
For instance, why is it harder to maintain muscle mass as we age? Is it because of an age-related decline in hormonal stimulus for muscle mass, or is it because of a decreased functional activity that stimulates our muscles?
Is it both? What’s the ratio? The best way to find out is to work on improving the process and see what is possible.
HRV is similar: it declines with age. Some cases are probably due to innate age-related decline, but some are also probably reversible if addressed appropriately.
HRV is new to the medical world. We physicians are constantly learning; as we do, we share new information with our patients.
What About the Heart Rate Variability Chart by Age?
The heart rate variability chart by age is deceptive. Because of inherent genetic and age-based differences, you can’t compare your values to others.
Although it’s human nature to compare ourselves to others, HRV is individual. (My experience demonstrates this — I’m 62, and my average HRV is down to 20 or 25, which is on the low end of any age-based chart.)
Your HRV is relevant only to your own changes over time. Comparing those changes gives you an accurate picture of your heart rate variability and resiliency.
Once you have an accurate baseline number, you can work to improve it.
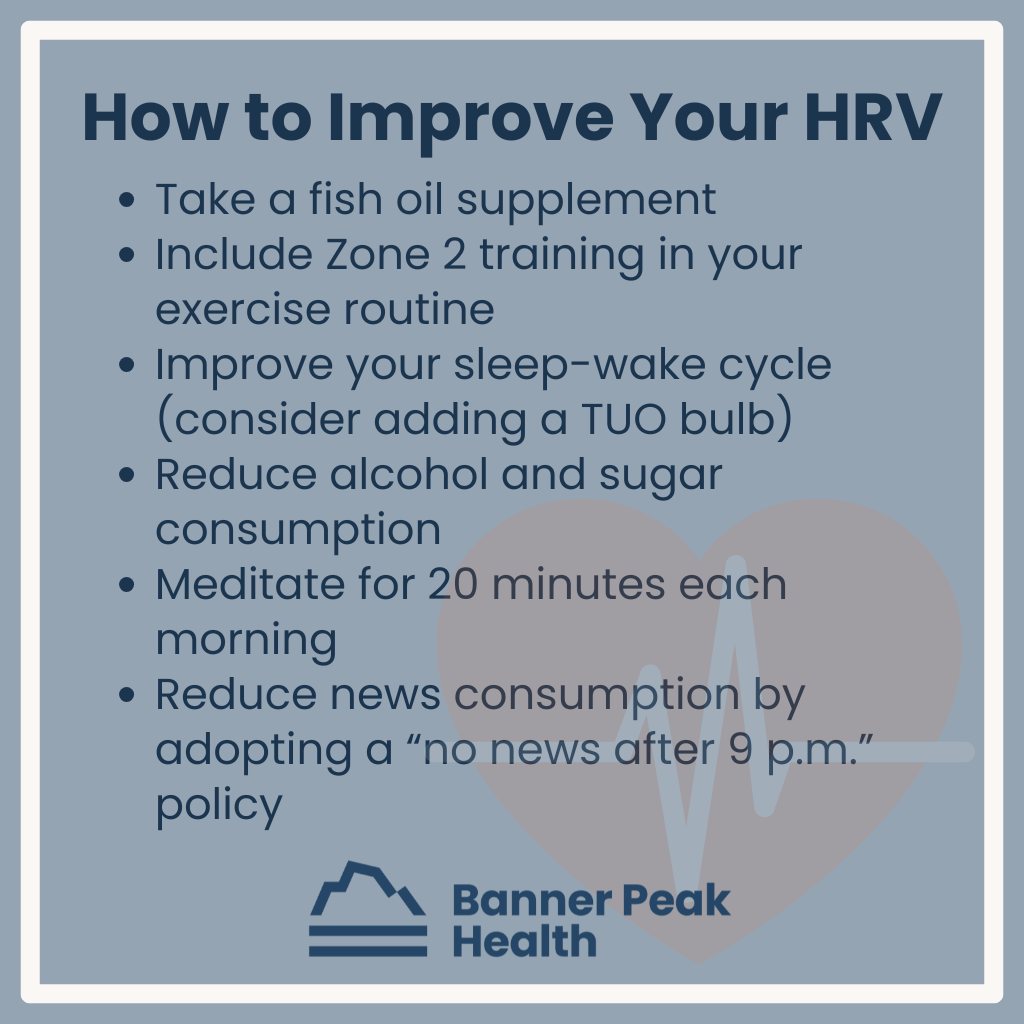
Improving Your HRV
I wrote a blog post about HRV and how to address and improve it based on my personal experience.
Here are the CliffsNotes:
- Take a fish oil supplement
- Include Zone 2 training in your exercise routine
- Improve your sleep-wake cycle (consider adding a TUO bulb)
- Reduce alcohol and sugar consumption
- Meditate for 20 minutes each morning
- Reduce news consumption by adopting a “no news after 9 p.m.” policy
Remember, you want to beat your numbers, not anyone else’s or those you see on a heart rate variability chart by age.
How to Get an Accurate HRV Reading
HRV can be calculated and measured in different ways. For instance, if your Oura Ring says your HRV is “24,” that may differ from the heart rate variability chart by age's “24” because each source calculates HRV differently.
Every time you measure HRV, the environmental factors must be identical and reproducible. Also, because your parasympathetic nervous system (rest and digest) determines your HRV, you must measure it when you’re resting. Try measuring at the same time every morning before you get out of bed while you’re still calm and at rest.
Don’t rely on HRV data from Apple Watches. They claim to provide HRV data “throughout the day,” but that’s impossible because of the nature of accurate HRV data.
Today’s Takeaways
As you age, your HRV declines. You probably won’t like the number you see the first time you measure it. Thankfully, it’s not set in stone. With some determination, you can change your HRV and improve your healthspan.
Don’t rely on a heart rate variability chart by age. Instead, strive to improve your numbers over time.
If you’d like help measuring or improving your HRV, don’t hesitate to schedule an appointment with our team.
