The ApoB Test: The Cardiovascular Marker You May Never Have Heard Of
What do the United States, Liberia, and Myanmar have in common? They’re the only three countries on the planet that don’t use the metric system.
The rest of the world’s 7.85 billion people measure in meters and kilograms. We’re still using the U.S. customary system, a clunky relic in which 12 inches equal one foot and 5,280 feet equal a mile.
Our system isn’t better. The metric system is simpler, more logical, and universally adopted. But we stay the course out of inertia: it’s the way we’ve always done it, and the effort to change feels too large.
The situation in cardiovascular medicine is strikingly similar. American physicians continue to rely on LDL cholesterol (LDL-C) as the primary treatment target for coronary artery disease, even though a more accurate marker, apolipoprotein B (ApoB), has been available for years.
The Europeans have already made the switch. We’re still debating it.
Europe vs. America: A Guideline Gap
As early as 2019, the ESC and EAS dyslipidemia guidelines stated that ApoB was “a more accurate marker of cardiovascular risk than LDL-C.” They provided specific ApoB treatment targets.
By contrast, the 2018 ACC/AHA cholesterol management guidelines mentioned ApoB only as a “risk-enhancing factor to consider in borderline patients,” with no specific treatment targets or recommendations.
Fast forward to 2026: the ACC/AHA dyslipidemia guidelines have given ApoB greater prominence, but the recommendations remain almost entirely built around LDL and non-HDL-C as primary targets.
The U.S. lags behind Europe in formally adopting the ApoB test as a treatment target, and the delay costs patients early detection of cardiovascular risk. The reasons mirror the metric system problem: decades of randomized controlled trials used LDL-C as the endpoint, clinical workflows are built around LDL targets, and switching requires more effort than staying the course.

What ApoB Is and Why It Matters
Apolipoprotein B (ApoB) is a protein that sits on the surface of every lipoprotein particle in your blood containing potentially hazardous cholesterol: LDL, VLDL, IDL, and Lp(a).
Exactly one ApoB molecule sits on each particle. That means measuring ApoB counts the exact number of dangerous particles circulating in your bloodstream.
Picture two highways (your arteries). Highway A has 100 large trucks, each carrying a heavy load of cargo (cholesterol). Highway B has 200 smaller sedans, each carrying a lighter load. If you measure only the total amount of cargo on each highway, the two might look equivalent.
But Highway B, with twice as many vehicles, has a much higher probability of fender benders: collisions where the contents spill into the vessel walls. That spillage, cholesterol being absorbed into artery walls, is the disease process of atherosclerosis.
The ApoB test counts the vehicles on the highway, not just the total cargo, and the number of vehicles predicts crashes more accurately. Cholesterol isn’t inherently dangerous.
It performs normal physiologic functions throughout the body. The danger arises when lipoprotein particles crash into vessel walls and deposit their cholesterol where it doesn’t belong.
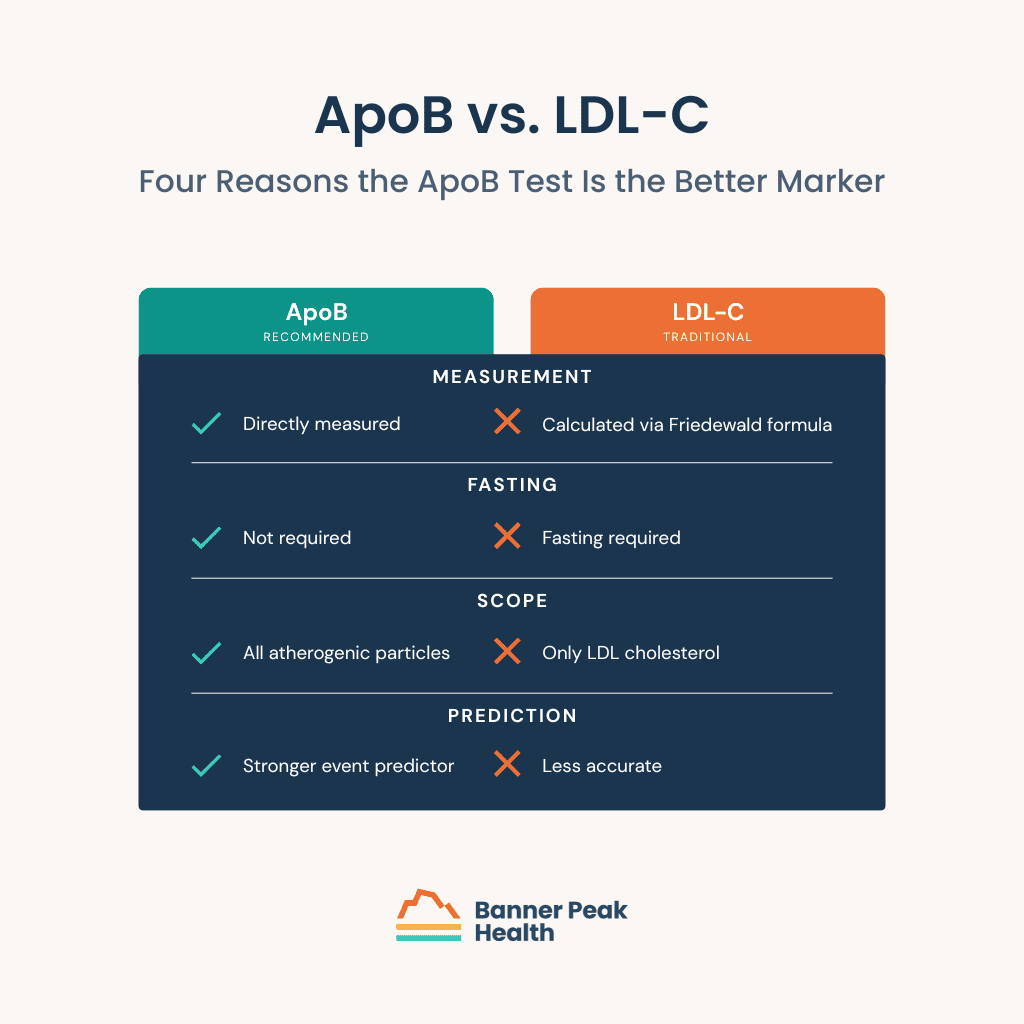
Four Reasons the ApoB Test Is the Better Marker
First, ApoB is directly measured. LDL-C is calculated from other values using an equation (the Friedewald formula), introducing a source of mathematical error. A direct measurement is more precise.
Second, ApoB doesn’t require fasting. The LDL-C calculation does. This sounds trivial, but it affects how reliably patients get tested. Fasting requirements create compliance barriers that reduce testing frequency.
Third, ApoB captures all atherogenic particles in a single number. LDL-C reflects only the cholesterol within LDL particles, an incomplete accounting. The cholesterol distributed across VLDL, IDL, and Lp(a) particles goes uncounted; ApoB catches them all.
Fourth, the ApoB test is a stronger predictor of cardiovascular events than LDL-C. It more accurately identifies who will have a heart attack. That’s the metric that matters most.
What Your ApoB Number Means
When you get your ApoB results, you’ll receive a number measured in milligrams per deciliter (mg/dL). Interpreting that number requires the same nuance we’ve discussed in the context of other lab values like hemoglobin A1C: “normal” and “optimal” aren’t the same.
Some labs report ApoB as normal at levels ranging from 120 to 130 mg/dL. That range isn’t healthy. In a society with widespread hyperlipidemia, average is not a target to aim for.
Optimal ApoB levels fall below 90 mg/dL for most adults and below 80 mg/dL for individuals at high cardiovascular risk, including those with diabetes, chronic kidney disease, strong family history, or evidence of early heart disease.
This gap between “normal” and “optimal” has particular clinical relevance for patients with certain metabolic profiles. When HDL runs normal-to-low and triglycerides run normal-to-elevated, a constellation seen in insulin resistance, prediabetes, type 2 diabetes, metabolic syndrome, and obesity, LDL-C becomes less accurate as a risk predictor. ApoB remains reliable.
The numbers are striking: 50–60% of U.S. adults have one or more of these metabolic risk factors. That means roughly half of American adults have a lipid metabolism profile in which LDL-C alone can be misleading.
Getting an ApoB Test
Some physicians don’t order the ApoB test. It isn’t new, expensive, or hard to obtain.
The barrier is the same clinical inertia that keeps us off the metric system. EHR order sets, quality metrics, prior authorization algorithms, and decades of habit all revolve around LDL-C.
It’s a standalone blood draw available at any major commercial lab. It costs $15 to $30, doesn’t require fasting, and produces a single number that has greater predictive value than the traditional lipid panel. The rate-limiting step is the physician’s awareness of the test.
If your doctor doesn’t order an ApoB test, ask for it. At an annual executive health screening or a routine visit, adding ApoB to the lab order takes seconds and can change the trajectory of your cardiovascular care.
Today’s Takeaways
The ApoB test is the cardiovascular equivalent of adopting the metric system: a more accurate, more practical measurement that the rest of the developed world has already embraced. The U.S. is catching up, but inertia is slow to overcome.
If you have a lipid panel that looks “normal” but carries metabolic risk factors, an ApoB result might tell a different story. If you’re already managing cardiovascular risk with lifestyle changes and medication, ApoB provides a sharper lens for evaluating your progress.
At Banner Peak Health, we include ApoB in our standard cardiovascular risk assessments. We continue to evaluate and implement advanced diagnostic tools to reduce coronary artery risk.
But don’t worry: we’ll still discuss your weight in pounds and not kilograms, if that’s what you prefer.
Contact Banner Peak Health to discuss ApoB testing and your cardiovascular risk profile.

How to Read Your Calcium Score Test: What 0 to 1,000 Means
I’ve been studying medicine for 40 years and have treated thousands of patients. I’ve learned you don’t fully grasp the meaning of a diagnosis until you or a family member has lived it.
All healthcare exists on two planes: biology (our bodies) and psychology (how we feel about our bodies). My experience transitioning from a negative to a positive calcium score test gave me new insight into both.
I’ve always been thin and athletic, carrying a self-image of being a “healthy guy.” At 54, I underwent a coronary artery calcium scan and received a score of zero: no detectable calcium in my coronary arteries.
No other risk factors flagged. My identity as “the healthy guy” was reinforced.
Seven years later, I repeated the scan. This time, my score came back at 14, mildly positive on a scale of zero to 1,000.
Even that small number changed my self-perception. A positive score meant I was developing atherosclerosis in my coronary arteries, a process likely occurring throughout arteries in my body.
I reviewed my cholesterol panel, which showed no red flags: total cholesterol 185, HDL 49, LDL 127, ApoB 102. None of those numbers screamed danger.
But given the positive calcium score, the cholesterol values became less important. My body was developing coronary artery disease regardless of how “okay” my panel looked.
In consultation with my doctor, I started a low-dose statin: half of a 5mg rosuvastatin (Crestor) tablet daily. My repeat cholesterol panel was striking: total cholesterol 145, HDL 50, LDL 82, ApoB 72, with a 30–35% reduction in LDL and ApoB. That medication reduced my risk of a major cardiac event by 20–30%.
My perception of being a “healthy guy” was dented. But I was 20–30% less likely to have a heart attack and die, and the peace of mind of knowing I’m slowing down the clogging of my pipes has independent value. Without that scan, I never would have known.
When Blood Work Isn’t Enough
A standard annual blood panel, including HDL, LDL, triglycerides, and (if your doctor orders it) ApoB, gives you a statistical estimate of future risk. If those numbers fall in the normal range, it’s natural to feel reassured.
The problem: Approximately half of all MI patients present with LDL cholesterol levels that are not considered elevated (LDL-C <100 mg/dL). Routine blood work alone doesn’t catch them.
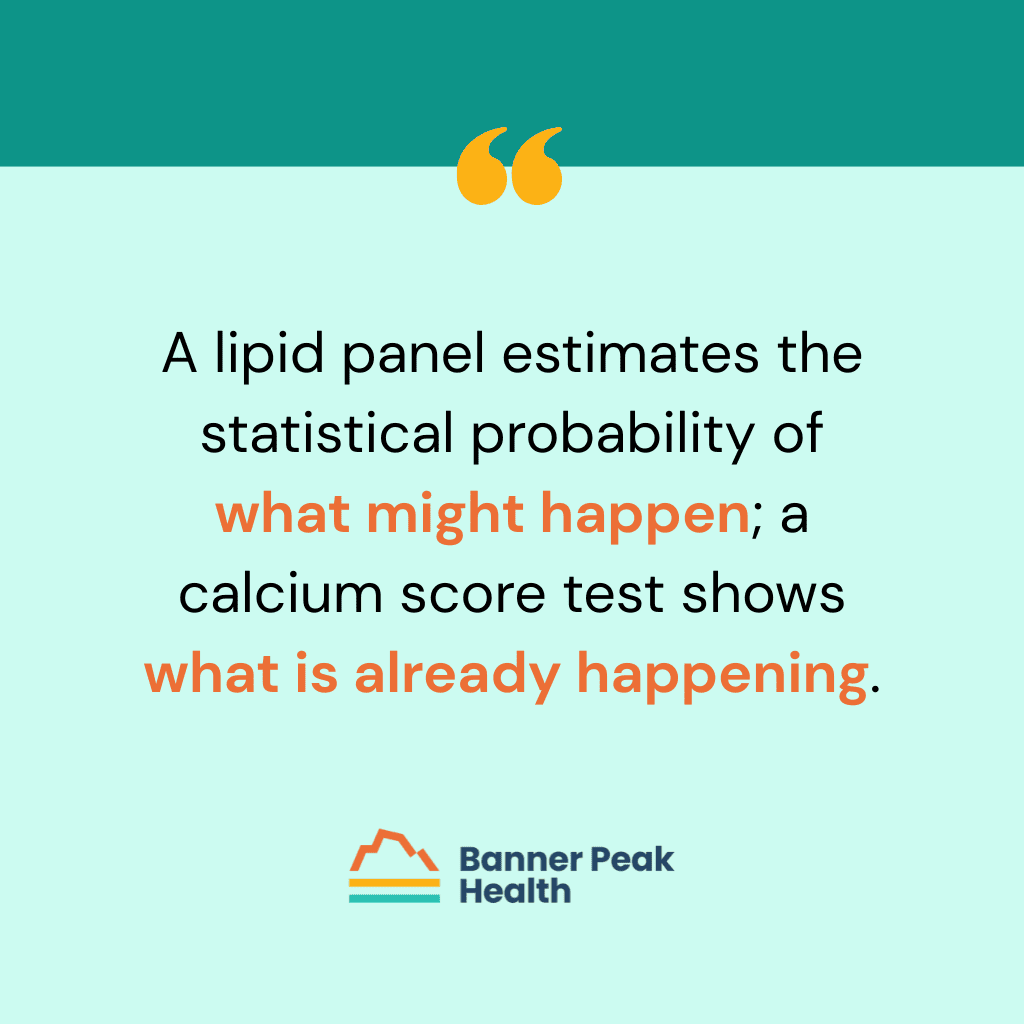
A lipid panel estimates the statistical probability of what might happen; a calcium score test shows what is already happening. The distinction is the difference between a weather forecast and looking out the window. One predicts; the other confirms.
How the Calcium Score Test Works
Calcium is radio-opaque, meaning X-rays can’t pass through it. A CT scan (a three-dimensional X-ray) exploits this property to image calcium deposits in the coronary arteries.
The calcium score test is one of the simplest and most informative cardiac screenings available. No IV, no contrast dye, no treadmill. You lie on a table, hold your breath, and in fewer than 10 minutes, you’re done.
The result is a single number, your Agatston score, on a scale from zero to over 1,000.
This screening sits in a unique space. A standard executive physical might include detailed blood work and a physical exam, but few panels directly image the coronary arteries. The scan fills that gap.
What the Scores Mean
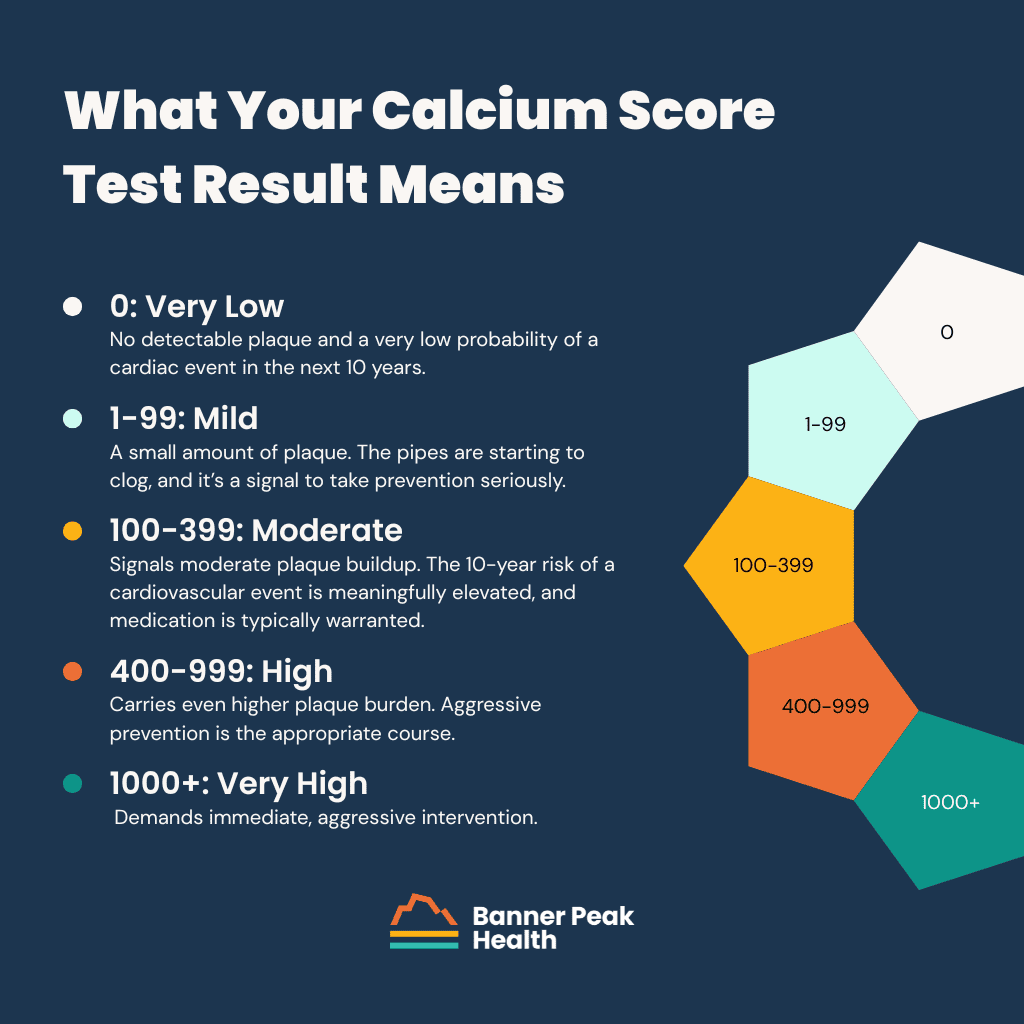
The Agatston score is divided into ranges, each with a different clinical implication:
- A calcium score test result of zero means no detectable plaque and a very low probability of a cardiac event in the next 10 years. This is the best possible outcome. It doesn’t guarantee immunity from heart disease, but it’s strongly reassuring.
- A score of one to 99 indicates a small amount of plaque. The pipes are starting to clog, and it’s a signal to take prevention seriously. Lifestyle modification is the first step. For some patients, this range tips the conversation toward medication, particularly statins. After nearly 40 years of clinical experience with this drug class, the risk-benefit profile of statins remains among the most favorable in medicine, with side effects that are rare and typically reversible (most commonly muscle aches, similar to those with other cardiac medications).
- A score of 100 to 399 signals moderate plaque buildup. The 10-year risk of a cardiovascular event is meaningfully elevated, and medication is typically warranted.
- A score of 400 to 999 carries an even higher plaque burden. Aggressive prevention is the appropriate course.
- A score of 1,000 or above demands immediate, aggressive intervention.
How to Read Your Percentile Rank
The report will include a second number: your percentile rank. This compares your score with those of other people of your age and gender.
For example, my score of 14 at age 61 put me in the 33rd percentile, meaning 33 out of 100 theoretical men my age would have had less coronary calcium, and 67 would have had more. If that same score of 14 had occurred at age 40, it would have placed me in the 90th to 95th percentile, worse than 90 to 95% of the age- and gender-matched cohort. Same absolute number, vastly different clinical significance.
The percentile tells you how far along the atherosclerosis progression you’ve traveled relative to your peers. But a common trap exists here: “normal” or 50th percentile might still indicate elevated risk.
In a society with high rates of hyperlipidemia, average doesn’t mean optimal. We’ve explored this theme in our discussion of healthy vs. normal cholesterol ranges, and the same logic applies.
Your calcium score percentile rank shows where you stand on the atherosclerosis continuum compared to others your age, but “average” in an unhealthy population isn’t a number you want to settle for.
Taking Action
The gift of this scan is knowledge. The next step is a careful conversation with your doctor about your cardiovascular risk profile, personal preferences, and a plan moving forward.
In my own case, the positive score prompted a statin that cut my LDL and ApoB by 30 to 35%. That kind of reduction, paired with lifestyle strategies like fish oil supplementation for cardiovascular risk and regular exercise, compounds over time. The benefit at 10 years is meaningful, and beyond 10 years, the risk reduction grows substantially as the baseline risk climbs with age.
Use the data from your calcium score test as the starting point for a risk-reduction conversation with your physician. Don’t let a positive score spiral into fear, and don’t let a zero score create false complacency.
Why Isn’t the Calcium Score Test Standard?
The calcium score test costs approximately $100 to $250 out of pocket, takes fewer than 10 minutes, and carries a radiation dose comparable to a mammogram. By most measures, it’s one of the most powerful cardiovascular screens available.
Insurance rarely covers it. Explaining why would require a separate article and leave nobody feeling cheerful. If you have the financial resources, this is one of the best places to put your healthcare dollar.
Today’s Takeaways
My story follows a familiar arc: a “healthy guy” with a normal-looking cholesterol panel who, without the calcium score test, would have missed the early signs of coronary artery disease. Half of all heart attacks happen to people in exactly that position.
The test is fast, inexpensive, and low-risk. The number it produces, your Agatston score, moves the conversation from statistical estimates to anatomical reality. It can guide cardiovascular risk management in a way no blood test alone can.
Ask your doctor about it. And if your doctor doesn’t bring it up, ask anyway. The rate-limiting step isn’t the test itself; it’s the awareness to order it.
At Banner Peak Health, we run calcium score testing as part of our standard cardiovascular risk assessment. Contact Banner Peak Health to discuss whether this screening makes sense for you.

Is a Whole Body MRI Worth It? A Physician’s Honest Take
Is sunshine good or bad?
The honest answer depends on context, degree, and perspective. Sunshine grows crops, powers solar energy, and lifts our mood. It can also cause skin cancer, contribute to drought, and accelerate climate change.
Most medical decisions operate in this same gray area, yet we crave binary verdicts: good or bad, safe or dangerous, worth it or not. Whole body MRI doesn’t fit neatly into either column.
Direct-to-consumer marketing has fueled a boom in these scans, with standalone centers offering these screenings for $1,000 to $2,000, no physician referral required. The pitch positions the scan as a sort of do-it-yourself executive physical: detect problems early and buy yourself peace of mind.
Peace of mind is a powerful promise. For most people, the math tells a different story, one in which a whole body MRI creates more anxiety than it resolves.
What a Whole Body MRI Can and Can’t Detect
The scan performs well at detecting solid organ tumors in the kidney, liver, and prostate. It can identify intracranial aneurysms (dangerous dilations in the brain with rupture potential) and soft tissue masses, all without ionizing radiation, a meaningful advantage over CT-based screening.
The modality does find cancer. A 2026 meta-analysis in European Radiology, reviewing data from 9,000 asymptomatic individuals, found a cancer detection rate of 1.57%.
For specific high-risk genetic conditions, the evidence supports routine screening. NCCN guidelines recommend annual screening MRI for individuals with Li-Fraumeni syndrome, a genetic predisposition carrying an elevated risk of solid tumors. In this select population, the scan earns its place in a proactive cancer prevention plan.
Whole body MRI can detect solid organ tumors and brain aneurysms without radiation, but it can’t replace targeted screenings for the most common cancers. Colon cancer, breast cancer, and thyroid cancer each require dedicated screening modalities: colonoscopy, mammography, and ultrasound. A clean scan result can create a false sense of security and leave these cancers undetected.
Screening vs. Diagnostic: Why the Distinction Matters
A diagnostic MRI starts with a hypothesis. Your physician suspects a lesion, a symptom points to a specific organ, and the scan focuses on answering a targeted clinical question.
A screening MRI is the opposite: a fishing expedition. No specific symptom or finding prompted the scan. The modality sweeps across the entire body looking for any abnormality.
Knowing the difference between a screening MRI and a diagnostic MRI changes how you interpret the results. The purpose and recommended frequency of medical testing change dramatically depending on whether you’re screening a healthy population or diagnosing a symptomatic patient. Screening a low-risk population with a broad-sweep imaging tool produces a flood of false positives.
The Math Behind a Whole Body MRI
Approximately one-third of asymptomatic adults who undergo this screening have incidental findings: liver cysts, renal cysts, disc bulges, uterine fibroids. These findings look alarming on a report, but they aren’t cancer. The false positive rate is the central problem with whole body MRI screening.
Consider a hypothetical scenario: 1,000 healthy 45-year-olds with no elevated cancer risk undergo screening. With a cancer prevalence of 0.2% (two people in 1,000 with actual cancer), a sensitivity of 90%, and a specificity of 68%, the numbers break down like this:
- Two people receive true positive results. They have cancer, and the scan found it.
- 319 people receive false positive results. The scan flagged an abnormality that isn’t cancer.
The positive predictive value (the probability that a positive result is truly positive) is 0.6%. If you put those 321 people with positive results in a room and tell them they might have cancer, only two of them actually do.
This math isn’t unique to this modality. It’s a principle of probability that applies to every screening and diagnostic test.
Any test’s usefulness depends on how likely you were to have the disease before the test. When you screen a low-risk population, even a sensitive test generates more false alarms than real diagnoses.
The False Positive Cascade
Those 319 false positives don’t end with an email and a shrug. Each one triggers a cascade of follow-up steps, each carrying its own costs in time, money, and emotional toll.
First comes the notification: a phone call informing you of a finding that “might be cancer, might not be.” Anxiety begins immediately. Next, follow-up imaging: a contrast-enhanced MRI or CT scan that costs thousands of dollars and takes weeks to schedule, all with uncertainty hanging overhead.
Depending on the finding’s location and appearance, a specialist consult may follow. Then, potentially, a biopsy, an invasive procedure with its own physical risks. If the biopsy proves inconclusive, the next step is serial surveillance: reimaging at three, six, or 12 months.
For the overwhelming majority of those 319 people flagged by the screening scan, weeks or months of heightened stress and physiological strain, thousands in additional testing, and the physical risk of invasive procedures end with the same answer: no cancer. The promise of peace of mind delivered its opposite.
The Direct-to-Consumer Problem
A standalone scanning company collects $1,000 to $2,000, performs the scan, hands over a report, and walks away from the relationship. Your existing healthcare team is then responsible for the entire workup cascade described above. This is the “take the money and run” model of healthcare.
Direct-to-consumer whole body MRI centers profit from scanning as many people as possible, regardless of individual appropriateness. A for-profit center won’t decline a paying customer whose risk profile doesn’t justify the test.
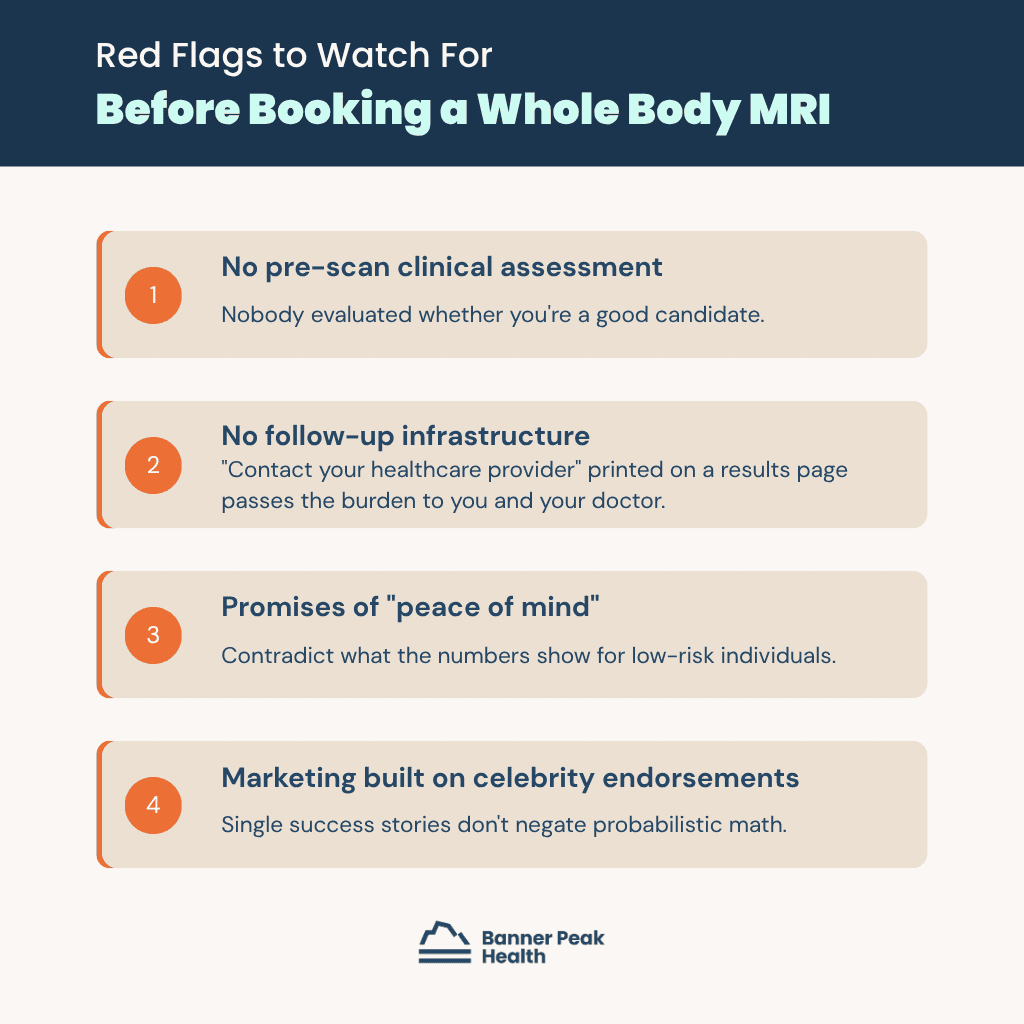
Watch for these red flags before booking a scan. No pre-scan clinical assessment means nobody evaluated whether you’re a good candidate. No follow-up infrastructure means “contact your healthcare provider” printed on a results page passes the burden to you and your doctor.
Promises of “peace of mind” contradict what the numbers show for low-risk individuals. Marketing built on celebrity endorsements or single success stories doesn’t negate probabilistic math.
A concierge medical practice takes a different approach: a physician who knows your history orders the test, frames your pre-test probability, and owns whatever the scan finds.
Today’s Takeaways on Whole Body MRI Scans
The whole body MRI question depends on your clinical context and your pre-test probability of cancer. It depends on your personality and tolerance for the anxiety that comes with a modality heavy with false positives. It depends on whether your healthcare environment can adequately work up an incidental finding.
For individuals with genetic syndromes carrying elevated cancer risk, the math is different. When the pre-test probability rises from 0.2% to 10%, the positive predictive value can climb to 50%: one false positive for every true positive. For these patients, the scan earns its place.
The same logic applies to aneurysm screening. The false positive rate remains high, and no evidence demonstrates improved mortality in average-risk populations.
For the average healthy adult without elevated risk, the odds stack against benefit. A whole body MRI is extra sauce in a layered early detection strategy, not the main course. Don’t let a slick advertisement replace a conversation with your doctor.
Have questions about advanced diagnostic screening? Contact Banner Peak Health to discuss whether this or any screening makes sense for your individual risk profile.

Peptide Therapy: A Doctor’s Warning About the Gray-Market Trend
Peptide therapy is the talk of the town right now. It shows up in wellness influencer feeds, online sellers, and clinic offerings. Most of what’s being sold isn’t proven, isn’t regulated, and doesn’t belong in anyone’s body.
The story everyone wants to tell is about the therapeutic potential of these compounds. The harder story, and the one worth telling, is about how patients, physicians, and society decide what goes into our bodies.
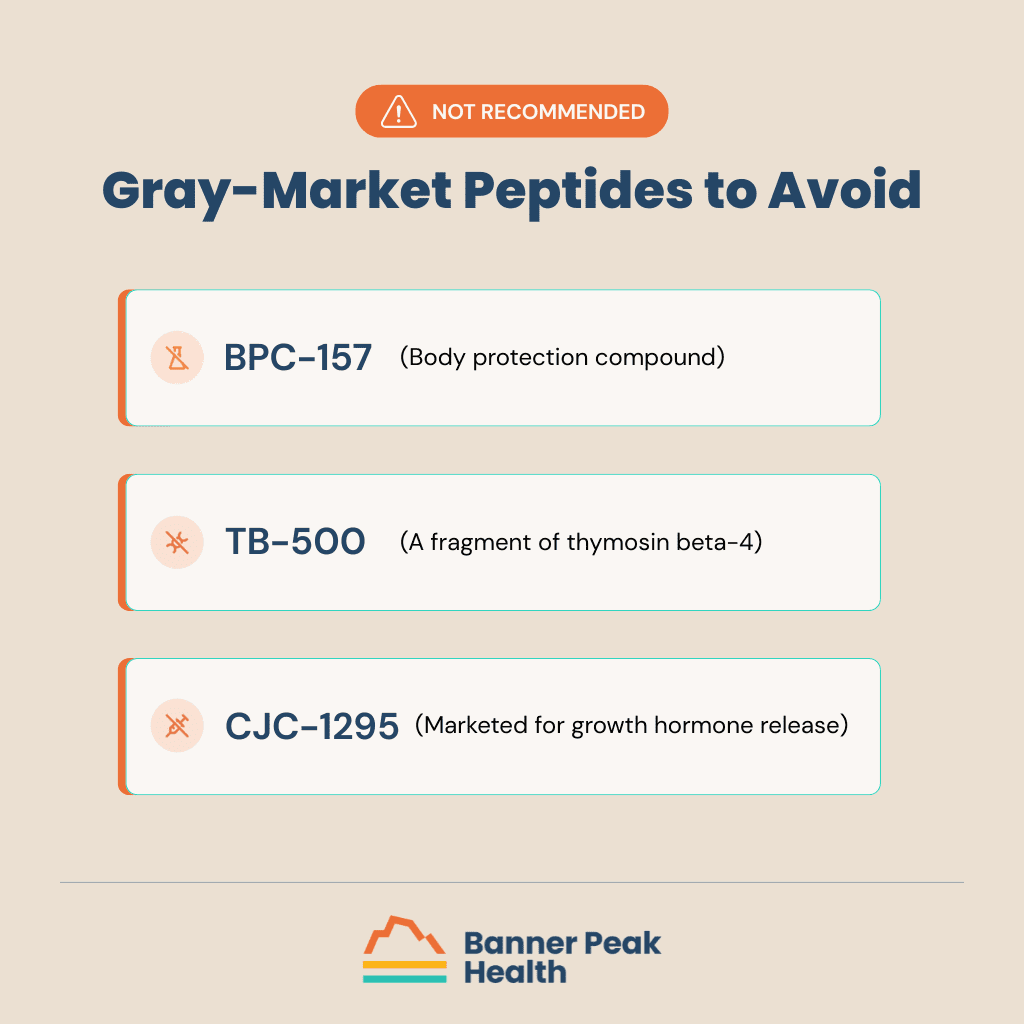
Here’s the short answer on gray-market peptides like BPC-157, TB-500, and CJC-1295: I don’t recommend them. The longer answer says more about how we think about evidence and hype than about any one compound. Patients curious about where the line falls between approved GLP-1 medications and gray-market versions will find that distinction is at the heart of the matter.
What Are Peptides?
A peptide is a chain of amino acids, the same building blocks that make up proteins in the body. Think of beads on a string, 20 to 50 long, folding into a three-dimensional shape that gives the molecule its function.
These small structures act as chemical messengers, regulating hunger, blood sugar, growth, and immune function. The body produces thousands of them. Insulin is the most familiar peptide hormone in the body, the one that controls blood sugar.
Beyond what the body produces, more than 80 peptide drugs hold FDA approval, with hundreds more in development. These are well-studied medications used in mainstream medicine, with documented safety and efficacy.
FDA-Approved Peptides vs. Gray-Market Peptides
Approved peptide drugs come with substantial clinical data. The GLP-1 agonists semaglutide (Ozempic, Wegovy) and tirzepatide (Mounjaro) have both been studied in tens of thousands of patients across the STEP and SURMOUNT Phase 3 programs, alongside tesamorelin (Egrifta) and other approved peptide drugs. Their production is regulated for safety and purity.
Gray-market peptides sit on the other side of the line. Compounds like BPC-157 (body protection compound), TB-500 (a fragment of thymosin beta-4), and CJC-1295 (marketed for growth hormone release) are sold online without FDA approval. These peptides carry a “for research use only” label, which sidesteps FDA oversight as they reach consumers.
The label is the epitome of irony. A compound marked for “research” and then injected into people without any valid human studies has the worst of both worlds: no oversight and no proof.
For a clear contrast to the gray-market approach, read our guide on how to make safe choices with supplements.
The Risks of Gray-Market Peptides
The risks break into two categories. The first is the biological risk of the compounds themselves. The second is contamination and poor manufacturing.
On the compound side, growth hormone-releasing peptides like CJC-1295 carry a theoretical risk of insulin resistance, joint pain, fluid retention, and abnormal tissue growth, the medical euphemism for cancer. TB-500 and related peptides that promote blood vessel growth carry a parallel theoretical risk of stimulating tumor growth, with no human studies to quantify its magnitude.
The manufacturing risk is documented rather than theoretical. Testing of gray-market peptide products has reported purity levels ranging from 5% to 75%. The unknown remainder includes arsenic, lead, and other heavy metals, as identified in independent testing.
Bacterial contamination raises the stakes further. Injection beneath the skin bypasses the body’s first lines of immune defense, so the risk of infection runs well above that of oral medications. The combination of unknown purity and infection risk makes any individual gray-market peptide injection unpredictably dangerous.
The Decision Behind Peptide Therapy
Decisions about what to put in our bodies happen at three levels: the individual, the physician, and society.
Individual decisions sit at the center. Personal beliefs shape them, including religious and philosophical views on foreign substances, comfort with new technology, and personal risk tolerance. External forces shape them, too, including family, friends, social media, influencers, podcasts, and institutional medicine.
Physicians sit further from the action than we tend to think. The medical community overestimates its own influence on individual decisions and underestimates the role of social and cultural forces. The peptide trend exists at this intersection, where individual choice, social signals, and the limits of physician influence collide.
What COVID Taught Us About the Peptide Trend
The COVID vaccine experience taught the medical community a hard lesson about evidence and influence. Billions of doses had been administered worldwide following thousands of studies, with overwhelming evidence that the benefits exceeded the risks, yet vaccine hesitancy remained substantial enough to fuel a political movement.
The medical community learned that most people don’t think the way physicians do, and that scientific evidence has limits as a driver of individual choice. Group thinking, personal experience, and social signals carry as much weight as data, and often more.
Peptides show the same pattern in reverse: evidence is thin, yet the wave of interest and use keeps building. A dangerous combination drives the trend: plausible biology, compelling anecdotes, and insufficient data.
Today’s Takeaways
Gray-market peptides are not on my recommendation list. The evidence base is thin, the manufacturing is unreliable, and the risks are documented enough to take seriously.
The deeper lesson from the peptide trend is about how to think through medical decisions when the marketplace is loud and the data is quiet. Slow down and ask what’s been studied, by whom, at what scale, with what oversight.
For gray-market peptides, that answer is not enough.
At Banner Peak Health in Walnut Creek, we work with patients on exactly this kind of question. To talk through a specific peptide or treatment that’s caught your interest, reach out to our practice.
Frequently Asked Questions About Peptides
Are peptides safe?
FDA-approved peptide drugs like semaglutide and tirzepatide have substantial safety data from tens of thousands of patients. Gray-market peptides like BPC-157, TB-500, and CJC-1295 lack human trials and carry documented risks from both the compounds themselves and from manufacturing contamination.
Is BPC-157 legal in the United States?
BPC-157 is not FDA-approved for human use. The compound is sold online with a “for research use only” label, which sidesteps FDA oversight and allows it to reach consumers without the safety and efficacy review that approved drugs go through.
What’s the difference between FDA-approved peptides and gray-market peptides?
FDA-approved peptides have been studied in tens of thousands of patients with documented safety and efficacy, and their production is regulated for purity. Gray-market peptides are sold online without regulatory oversight, and independent purity testing of gray-market products has reported values as low as 5% and ranging up to 75%, with the remainder consisting of arsenic, lead, and other heavy metals.
Why are gray-market peptides risky to inject?
Injection bypasses the body’s first lines of immune defense, raising the risk of infection well above that of oral medications. Combined with unknown compound purity and documented heavy-metal contamination, any individual gray-market peptide injection becomes unpredictably dangerous.
Retatrutide: How a Triple-Hormone Drug Could Change Obesity Treatment
I’m not a basketball fan. That hasn’t stopped me from reaching for a basketball metaphor.
At 17, LeBron James appeared on the cover of Sports Illustrated, unprecedented attention for a high school junior. The hype panned out: number one NBA Draft pick, four NBA championships, four MVP awards, and the all-time NBA scoring leader.
Retatrutide appears to be the LeBron of weight loss drugs.
Phase 1 and Phase 2 trials are complete, and Phase 3 is ongoing. FDA approval remains several years out, but the data so far is striking enough that the drug made the cover of the New England Journal of Medicine before Phase 3 completion. For patients and physicians watching the field, retatrutide deserves attention alongside the current GLP-1 weight loss drugs.
What Is Retatrutide?
Retatrutide is a single peptide delivered as a once-weekly injection. Retatrutide is a triple agonist nicknamed “Triple G” for the three G-protein coupled receptors it targets at once: GIP, GLP-1, and glucagon.
Each hormone plays a role in how the body handles food, energy, and blood sugar. GIP and GLP-1 reduce food intake and improve insulin signaling. Glucagon receptor activation adds a third dimension that changes how the drug works at the metabolic level.
For background on the insulin and blood sugar side of this equation, see our blog post on hemoglobin A1C and blood sugar.
Why Retatrutide Adds Glucagon to the Equation
To grasp why retatrutide matters, look at what’s already on the market. Semaglutide targets GLP-1 alone. Tirzepatide targets GIP plus GLP-1.
Retatrutide adds the third agonist target, the glucagon receptor, which adds another mechanism for weight loss.
GLP-1 and GIP reduce food intake and improve insulin signaling, which helps with blood sugar control. Glucagon receptor activation operates on a different angle: it increases energy expenditure and promotes fat oxidation, the metabolism and burning of fatty acids in the liver.
The combined effect is potent: less food coming in, more calories burned, and active fat metabolism in the liver. This three-way mechanism is why the early retatrutide results have been so striking.
Readers tracking metabolic health may want to revisit our work on how to reset your metabolism.
The Phase 2 Retatrutide Trial Results
A quick primer on drug trials. Phase 1 tests safety in a small group. Phase 2 expands the sample, often with placebo control, and homes in on effective dosing. Phase 3 is the largest controlled trial and provides the data the FDA needs for approval.
Retatrutide’s Phase 2 results landed on the cover of the New England Journal of Medicine in 2023, before Phase 3 even finished. That fact alone speaks to the magnitude of what researchers saw.
The trial tested placebo against three retatrutide doses, including a maximum dose of 12 milligrams. At that 12-milligram dose, 100% of retatrutide participants lost more than 5% of body weight, 93% lost more than 10%, and 26% lost more than 30%.
Numbers of this magnitude are uncommon outside surgical interventions. The only other medical option producing this kind of weight loss is bariatric surgery. Weight loss curves had not plateaued at the 48-week trial stop point, so a longer trial could yield even larger results.
For context on what changes in body weight mean for health, see our discussion of BMI vs. body composition.
Retatrutide vs. Tirzepatide vs. Semaglutide
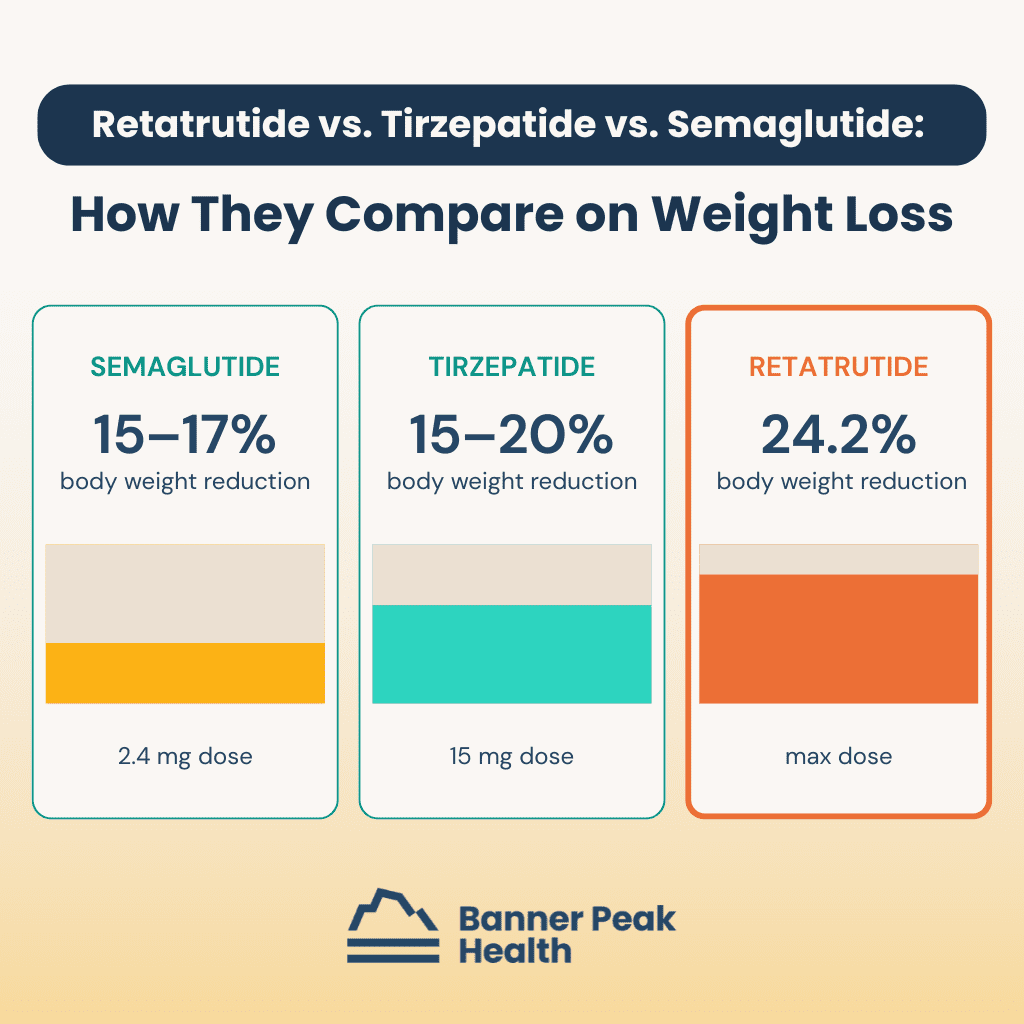
The comparison is what makes the early data so striking. Semaglutide at 2.4 milligrams (the dose used for weight loss) achieves a 15–17% reduction in body weight. Tirzepatide at 15 milligrams achieves 15–20%.
At the maximum dose, retatrutide achieved a 24.2% body weight reduction during the same trial period, the highest figure for any single agent.
These numbers aren’t apples-to-apples across separate trials, but the magnitude advantage is consistent: more receptor targets, more weight loss. The triple-agonist mechanism appears to produce the most potent weight loss yet observed with a single pharmacologic agent.
For readers interested in how the body’s weight regulation systems work, see our blog post about anabolism versus catabolism in weight loss.
Other Conditions Under Study With Retatrutide
The weight loss data was dramatic on its own. Other endpoints from the Phase 2 trial were similarly striking.
The drug reduced hemoglobin A1C by 2.2%, an industry-leading drop for this category. Systolic blood pressure dropped by nine mmHg. Triglycerides fell by 35%.
The most surprising finding from the retatrutide trial may have been the effect on liver fat: 86% of participants at the maximum dose had normal liver fat at the end of the study, with a mean reduction of 84%.
This matters for the growing population with MASLD (metabolic dysfunction–associated steatotic liver disease), a condition without good pharmacologic treatment until now. The ongoing Phase 3 trial will study retatrutide’s effects on obstructive sleep apnea, knee osteoarthritis, chronic kidney disease, cardiovascular progression, and type 2 diabetes.
Retatrutide Side Effects and the Discontinuation Concern
Every powerful drug has a cost. Retatrutide’s side effect profile lines up with the broader GLP-1 category, with gastrointestinal issues most common: nausea, vomiting, diarrhea, and constipation.
In the Phase 2 trial, up to half of retatrutide participants in the higher-dose groups reported these side effects. That rate is high but not out of line for the category. What concerned reviewers was the discontinuation rate, the share of participants who stopped taking the drug due to side effects.
Retatrutide showed a 17% discontinuation rate compared with 4% on placebo, roughly three times the 4.3–7.1% range seen in other GLP-1 medications.
This matters for what we call generalizability. Study participants tend to be healthier than the general patient population because exclusion criteria exclude comorbidities and older patients. They tend to be more dedicated than typical patients, the kind of people who volunteer for drug trials in the first place.
In the real world, with older patients and more health complications, the discontinuation rate will likely be even higher. Tolerability could be the deciding factor for individual patients considering retatrutide.
When Retatrutide Will Be Available
Merely being on the cover of NEJM won’t make retatrutide available on the market. Phase 3 trials need to finish, the data needs analysis and publication, and the FDA needs to grant approval. Clinical access remains several years away.
For patients in the Bay Area, we follow these developments closely. The team at our practice tracks emerging retatrutide research alongside the GLP-1 drugs already available, so our members have clarity on what’s working and what’s still in trials.
Today’s Takeaways
Retatrutide is the most exciting weight loss drug in the pipeline. The Phase 2 data shows weight loss approaching what previously required bariatric surgery, plus meaningful drops in hemoglobin A1C, blood pressure, triglycerides, and liver fat. The triple-agonist mechanism is new for the category.
The caveat is the 17% discontinuation rate, which suggests retatrutide may not be tolerable for the broader patient population.
If you’re following weight loss medications, retatrutide is worth tracking, and Phase 3 results over the next few years will tell us whether the early promise holds. Tools like continuous glucose monitoring help patients track their own metabolic baselines as these new options develop. To talk through what’s right for you, reach out to our practice.
Frequently Asked Questions About Retatrutide
When will retatrutide be available?
Retatrutide remains in Phase 3 trials. FDA approval requires Phase 3 completion, data analysis, peer review, and FDA evaluation. Clinical access is several years away.
How much weight loss does retatrutide produce?
In the Phase 2 trial at the 12-milligram dose, 100% of participants lost more than 5% of body weight, 93% lost more than 10%, and 26% lost more than 30%. Mean weight reduction reached 24.2% at 48 weeks, the highest figure published for any single weight loss agent.
How does retatrutide compare to Ozempic and Mounjaro?
On weight loss alone, retatrutide’s Phase 2 results exceeded the published numbers for semaglutide (Ozempic, Wegovy) at 15–17% and tirzepatide (Mounjaro) at 15–20%. The trade-off shows up in tolerability, with a discontinuation rate roughly three times that of other GLP-1 medications.
What are the side effects of retatrutide?
Gastrointestinal side effects are the most common: nausea, vomiting, diarrhea, and constipation. Up to half of participants in higher-dose groups reported these in the Phase 2 trial. The 17% discontinuation rate is the highest concern, roughly three times the 4.3–7.1% range for other GLP-1 medications.

Urolithin-A: The Supplement Your Doctor Hasn’t Told You About Yet
Aging is a lot like foreign travel. You don’t know what to expect until you get there.
As a 63-year-old endurance athlete who has logged tens of thousands of miles on my bike, I’ve watched my body change over the decades. I anticipated that maximum power output and endurance would diminish over time. What surprised me was how much longer recovery would take.
As a teenager, I rode hard day after day with no consequences. By middle age, I felt the effects the next morning. Now I feel a hard ride two days later.
This shift has changed my approach to training. Recovery now demands as much attention as the training stimulus itself. The fundamentals matter: adequate sleep, fluid intake, calorie and protein targets, stretching, and core strength to protect the spine, joints, and muscles.
In the context of better recovery, urolithin-A caught my attention. My experience taking it for several months, along with the supporting research, has convinced me this compound deserves more attention from those pursuing athletic performance after 50.
The Research on Urolithin-A
Two double-blinded, placebo-controlled randomized trials drew my attention. They studied different populations and produced consistent findings.
A 2025 study in Sports Medicine followed elite male runners with an average age of 27 through a four-week high-altitude training camp. The group taking urolithin-A showed reduced muscle inflammation and improved markers for mitochondrial function. In a 3K timed run, those on urolithin-A reported a lower rate of perceived exertion without faster times: same speed, less pain.
A 2022 study in JAMA Network Open followed older men and women with an average age of 72 over four months. Participants on urolithin-A showed improved muscle endurance and reduced muscle inflammation. The six-minute walk distance, a common functional marker in geriatric research, did not change.
The geriatric result echoes the runner finding: same distance, less muscle fatigue. Together, these studies support the concept that urolithin-A improves recovery even when peak performance stays the same.
My Personal Experience With Urolithin-A
For me, the research lined up with a real-world test on my own body.
Several months into taking urolithin-A, I noticed I could do the same bike rides and feel less sore and depleted the next day. At my age, that counts as a win. The running joke around my house is, “Oh my god, I feel like a 55-year-old again.”
When you’re 63, feeling like a 55-year-old is a win. This kind of recovery support fits the broader picture of exercise as the fountain of youth: small daily edges compound into meaningful longevity gains.
What Is Urolithin-A? Why Supplementation Matters
We’ve evolved in a symbiotic partnership with our gut bacteria. It’s a team sport, with us as the hosts and our gut microbes producing compounds we need.
When we eat ellagitannins, compounds in pomegranates, walnuts, strawberries, raspberries, and other berries, beneficial gut bacteria such as Enterocloster and Gordonibacter species break them down. The byproduct is urolithin-A.
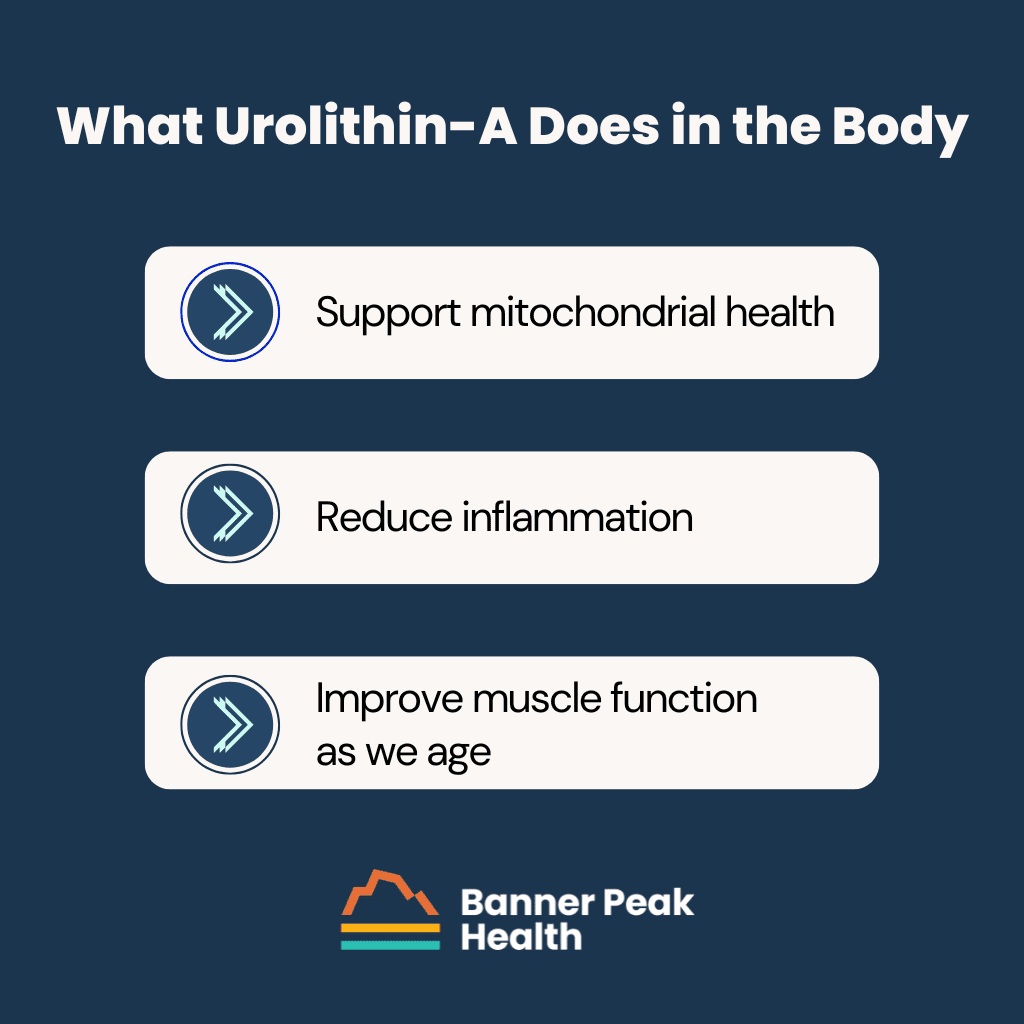
Urolithin-A appears to support mitochondrial health, reduce inflammation, and improve muscle function as we age.
The reason supplementation matters comes down to gut bacteria distribution. When researchers measure urolithin-A production in subjects who eat ellagitannin-rich foods, up to 50% of people don’t produce enough urolithin-A from food alone. Supplementation closes the gap for those individuals.
Anyone curious about how gut microbes shape our health will find more in our guide to prebiotic supplements and gut health.
How Urolithin-A Activates Mitophagy
To understand urolithin-A, we need to understand mitochondria, the tiny power plants inside almost every cell. Mitochondria convert food energy into ATP, the fuel for every system that keeps us alive and moving.
As we age, mitochondria become less efficient and accumulate damage. Cells produce less energy, generate more waste, and the cumulative effect contributes to fatigue, muscle weakness, and age-related decline.
The body has a built-in quality control process called mitophagy: identifying, eliminating, and replacing damaged mitochondria with healthy new ones. Picture a country’s electrical grid. Replace the worn-out plants with newer ones, and the entire system generates more power.
Urolithin-A is one of the most potent natural activators of mitophagy we’ve identified. It appears to stimulate the replacement of worn-out mitochondria with new, healthy ones. The decline in mitochondrial function helps explain why VO2 max declines with age and why supporting mitophagy matters for aging athletes.
Additional Urolithin-A Benefits
Beyond muscle endurance and recovery, urolithin-A shows benefits across several inflammation and metabolic markers. Trial participants taking the compound have shown reduced levels of C-reactive protein, a standard inflammation marker measurable through blood tests.
Other biomarkers tied to mitochondrial health improve under supplementation. Ceramides and acylcarnitines drop with supplementation. Both are blood markers researchers use to assess mitochondrial function from the outside.
These biochemical improvements suggest urolithin-A is working at the cellular level even when functional benchmarks haven’t shifted. The pattern mirrors how the vagus nerve calms inflammation: biological signals shift first, function follows.
What to Know Before Trying Urolithin-A
Clinical trials typically use 500–1,000 milligrams of urolithin-A per day. Studies have reported no serious side effects up to 2,500 milligrams daily, and the compound holds GRAS status, the FDA’s safety designation for established food ingredients.
Like all supplements, urolithin-A products differ in purity and formulation across brands. The brand I take is Mitopure, the same formulation used in most randomized controlled trials.
Mitopure synthesizes the molecule directly rather than fermenting ellagitannins with bacteria. The direct route yields a purer, more reliable product.
Recent studies have used 1,000 milligrams per day, so I recommend the 500-milligram tablets to hit that urolithin-A dose. A note on the brand options: A company called Timeline sells 250-milligram tablets dosed twice daily, which reaches only 500 milligrams. Mitopure manufactures Cellular Longevity Pro in 500-milligram tablets, 60 per bottle, which delivers 1,000 milligrams daily.
The product carries GRAS status, Clean Label Project certification, and NSF Certified for Sport. The last matters for competitive athletes, since NSF certification verifies a supplement contains no substances banned by sports federations. For broader guidance, see our work on safe choices with supplements.
Today’s Takeaways
For aging athletes especially, urolithin-A appears to be a worthwhile addition to the recovery toolkit. Two well-designed trials show reduced muscle inflammation and improved mitochondrial markers, albeit without a change in peak performance. My own experience matches the research, and at 63, I’m taking urolithin-A daily.
Three points sum up the case for the compound. About half of us can’t make enough of it from diet alone. Mitochondrial health declines with age, and the data so far shows a clean safety profile alongside growing biochemical support.
If you’ve been thinking about supporting recovery as you age, urolithin-A is worth a conversation. At Banner Peak Health in Walnut Creek, we track the literature on emerging tools like this one, alongside fundamentals like resistance training for longevity. To discuss whether urolithin-A fits your goals, reach out to our practice.
A Doctor’s Guide to Sleep Apnea Treatment Without CPAP
We’re in the middle of a revolution in sleep medicine, and I don’t use that word lightly.
For decades, the way we diagnosed and treated obstructive sleep apnea (OSA) followed a rigid, outdated playbook. A patient presented with obvious red flags: loud snoring, obesity, a neck circumference over 17 inches. We’d order an overnight polysomnogram at a sleep study facility, a cumbersome, expensive test that required 22 wires attached to the body.
The data captured a single night’s sleep, which may or may not have been representative. If we found OSA, we prescribed a CPAP machine with tubes and masks, and long-term compliance hovered below 50% of patients.
That model had two massive problems. First, the diagnostic threshold was so high (the testing was too expensive and inconvenient) that countless people with milder forms of sleep apnea went undetected. Second, the people we did identify often couldn’t tolerate the treatment.
The revolution has arrived, and it’s changed both sides of the equation: how we diagnose OSA and how we treat it. Cheaper, easier, multi-night monitoring tools have lowered the diagnostic bar, and a growing menu of non-CPAP treatment options has given us alternatives for mild-to-moderate cases.
Sleep apnea treatment without CPAP is now a clinical reality for a significant subset of patients.
What Is Obstructive Sleep Apnea?
We lose muscle tone during sleep. That loss increases the risk of the tongue falling backward and the throat muscles collapsing. When this happens, the result is partial or complete blockage of the upper airway, interfering with air passage to and from the lungs.
This interference reduces the amount of oxygen reaching the body and brain and triggers an adrenaline release that disrupts normal sleep.
Normal sleep physiology occurs in stages. OSA disrupts these stages by interfering with breathing, causing a cascade of serious problems.
In the short term, OSA can cause poor memory, headaches, and fatigue severe enough to make patients fall asleep driving. Long-term complications include increased risk of obstructive airway disease, heart attacks and congestive heart failure, non-alcoholic fatty liver disease, non-insulin-dependent diabetes, high blood pressure, insulin resistance, atrial fibrillation, and dementia.
Obstructive Sleep Apnea’s Impact on Hormones
OSA increases the release of stress hormones like adrenaline and epinephrine. It simultaneously reduces production of the hormones our bodies need most.
Beneficial hormones OSA reduces:
- Human growth hormone (HGH): Repairs and builds muscles.
- Testosterone: Maintains sexual function and healthy body composition in terms of muscle mass and fat distribution.
- Estrogen: Maintains healthy body composition and bone health.
Potentially harmful hormones OSA increases:
- Cortisol: Impairs immune function and increases the risk of obesity.
- Leptin: Decreases satiety.
- Ghrelin: Increases appetite.
Low testosterone is a common finding in patients with untreated sleep apnea. If you’ve been told your levels are low, it’s worth exploring whether OSA could be the culprit. Learn more about ways to naturally boost testosterone levels.
How Sleep Apnea Affects Athletic Performance
OSA impairs day-to-day functioning and athletic performance. Strength, endurance, and cognition all suffer.
In 2013, the Journal of Clinical Sleep Medicine examined 12 male, middle-aged golfers with severe OSA. The golfers underwent CPAP treatment, and after 20 rounds of golf, researchers evaluated every golfer’s handicap index.
The non-OSA control group showed no improvement. The OSA group treated with CPAP improved by 11.3%, and the more skilled players (handicap index below 12) improved by 31.5%.
I’m not a golfer, but I’ve worked with many and have recognized their devotion to the sport. This study proved they’ll go to any length to improve their game.
Golf relies on cognitive abilities to strategize and calculate risk/return, physical endurance for strength and accuracy, and emotional control to manage pressure. All these abilities improve with adequate sleep. Sleep’s effect on athletic performance is one of the most compelling arguments for diagnosing and treating OSA.
CPAP: Still the Gold Standard for Severe Cases
CPAP (continuous positive airway pressure) delivers pressurized air as you sleep to keep the airway open. For severe OSA, or mild-to-moderate OSA with risk factors for complications like heart attack, atrial fibrillation, stroke, or dementia and cognitive decline, a CPAP machine remains the first-choice treatment.
Unfortunately, for most people, CPAP evokes Darth Vader: a face obscured behind a large mask. Thankfully, CPAP machines have come a long way since their inception in the 1980s. They’re no longer vacuum cleaner-esque appliances, and even the full-face models are whisper-quiet.
If you can’t stand the thought of re-enacting the “Luke, I am your father” scene with your spouse every night, plenty of variations exist.
But here’s the fundamental problem: compliance rates remain stubbornly low. When less than half of prescribed CPAP users stick with the treatment, we need other options. The demand for sleep apnea treatment without CPAP has never been greater, and that’s exactly what the revolution in sleep medicine has provided.
The Revolution in Sleep Apnea Diagnosis
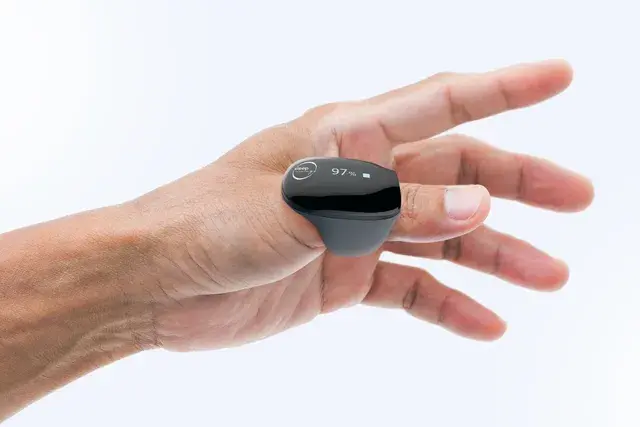
At Banner Peak Health, we partner with Empower Sleep and use their SleepImage device: an FDA-approved rubberized ring worn at the bedside. After more than two years of experience with our patients, this approach has changed how we practice sleep medicine.
The advantages over a traditional polysomnogram are dramatic. The device is cheap enough and easy enough that we don’t face the financial or logistic barriers of only testing the most obvious cases. We can screen broadly.
Unlike a single-night sleep study (conducted with 22 wires attached to your body in an unfamiliar facility), wearable health technology like the SleepImage ring lets us monitor patients night after night, week after week.
Sleep has tremendous variance: good nights, bad nights. Capturing that richness over time gives us a far more accurate picture of any individual’s sleep health than one snapshot ever could.
Here’s what we’ve learned. Mild sleep apnea exists in far more people than we previously realized. It’s an occult risk factor for obesity, fatigue, low testosterone, high blood pressure, and heart rhythm disorders.
With better diagnostic tools, we’re finding and treating OSA in patients who would have gone undiagnosed under the old model.
The diagnostic revolution has driven a therapeutic one. Now that we can monitor patients longitudinally, we can run experiments, test interventions, and fine-tune treatment plans with real data.
For patients already using a CPAP machine, we can assess whether the machine is performing as intended and adjust accordingly. For patients with mild-to-moderate OSA who don’t need (or won’t tolerate) a CPAP, we have a new approach: stacking.
Sleep Apnea Treatment Without CPAP: Stacking Therapy
Stacking means combining multiple therapies. Each individual treatment may offer only a modest benefit on its own. Cobble them together, and the combined effect can produce a clinically meaningful improvement in obstructive sleep apnea, all without a CPAP machine.
The beauty of stacking is the trial-and-error process, guided by ongoing monitoring with the SleepImage ring. We try a modality, measure the result over multiple nights, add another, and measure again. Each person’s stack looks different based on their anatomy, sleep patterns, and preferences.
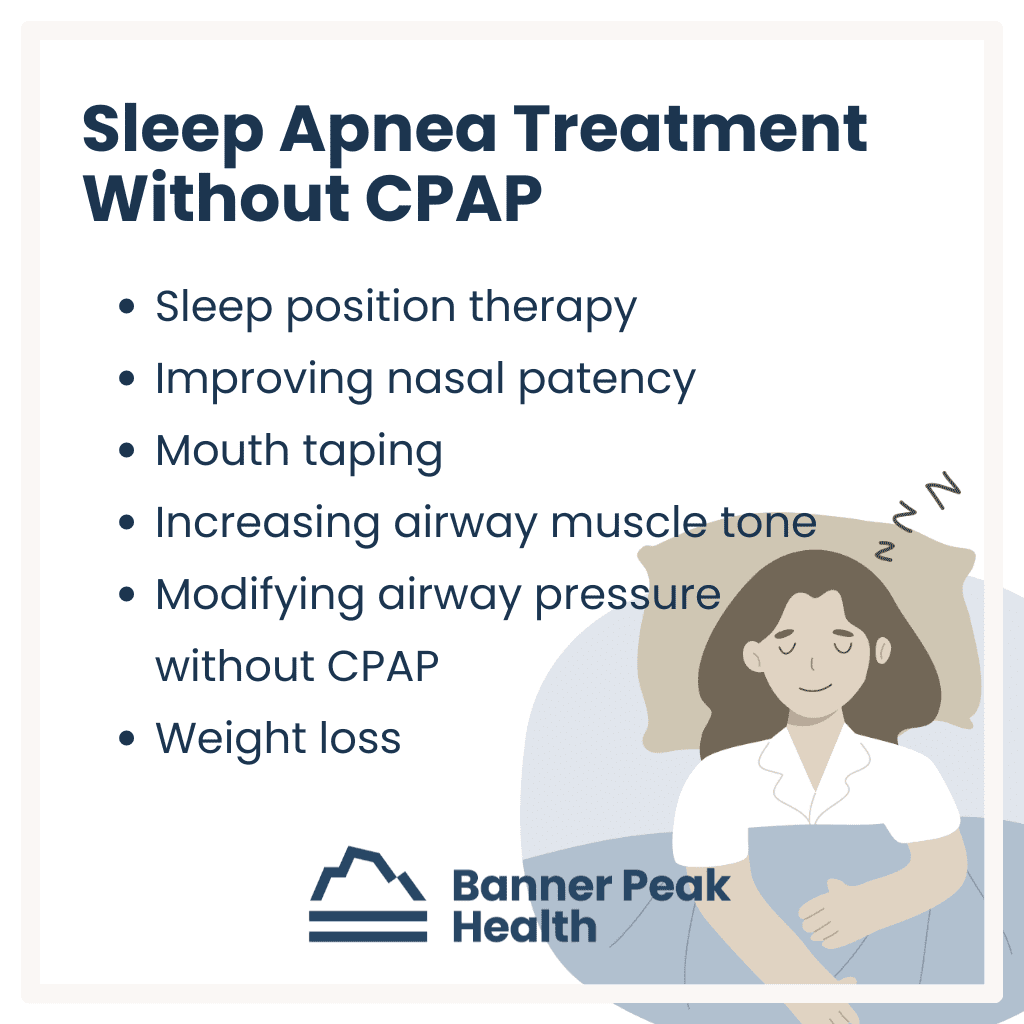
Sleep Position Therapy
Sleeping on the back (the supine position) worsens obstructive sleep apnea. Gravity compounds the risk of airway collapse. Side sleeping helps stabilize the throat muscles so they don’t interfere with air passage.
We use pillows, wedges, and specialized devices to help patients stay on their sides or stomachs during sleep. Positional therapy is one of the simplest forms of sleep apnea treatment without CPAP. With the SleepImage ring, we can verify whether these changes are making a measurable difference.
Improving Nasal Patency and Breathing
Our bodies evolved to breathe through the nose, but most people don’t breathe through their noses during sleep. This contributes directly to snoring and obstructive sleep apnea.
We address nasal breathing in layers. First, we work on nasal patency: improving airflow through the nostrils. Topical inhaled nasal glucocorticoids like Flonase shrink the mucosal lining and open the nasal passages.
We combine these sprays with nasal dilator devices to widen the passages further. You can learn more about these options in our guide to the best nasal sprays for congestion.
Once nasal patency improves, we train patients to stop mouth breathing through mouth taping. Mouth taping offers several benefits as a sleep apnea treatment without CPAP. Forcing air through the nose (instead of the mouth) tips the autonomic nervous system into better balance.
Mouth breathing physically lowers airway pressure and promotes collapse. When the mouth is closed, the tongue stays clamped in a more forward position, keeping the posterior airway clear.
Nasal breathing itself provides benefits beyond OSA. Explore our post on belly breathing benefits and techniques for more on optimizing your breathing patterns.
Increasing Airway Muscle Tone
Weak muscles lining the airway contribute to collapse during sleep. Strengthening them is another effective avenue for sleep apnea treatment without CPAP.
Excite OSA and the REMplenish Straw function like push-ups for the tongue, building tone in the muscles that support the airway. Mandibular advancement devices like myTAP and Zyppah bring the lower jaw forward. Since the lower jaw anchors the tongue, repositioning the jaw reduces the risk of the tongue falling back and obstructing the airway.
Modifying Airway Pressure Without CPAP
For patients who want some positive pressure support but can’t tolerate a full CPAP setup, Bongo Rx provides increased expiratory positive airway pressure. It’s a smaller, simpler device that adds one more layer to the stacking approach.
Weight Loss: A New Frontier in Sleep Apnea Treatment Without CPAP
Excess body weight, particularly around the neck and airway, is one of the most powerful drivers of obstructive sleep apnea. Weight loss has always been part of the treatment conversation, but a new class of medications has changed the calculus.
Tirzepatide (marketed as Zepbound) became the first FDA-approved medication for the treatment of moderate-to-severe OSA in adults with obesity. Two phase 3 clinical trials (the SURMOUNT-OSA studies) demonstrated substantial reductions in breathing interruptions during sleep. Participants on tirzepatide experienced a decrease of 25 to 29 events per hour, a meaningful improvement by any clinical measure.
We’ve written extensively about GLP-1 agonist side effects and the importance of weighing risks against benefits. That same caution applies here.
Zepbound’s data for OSA is compelling, and for patients whose obstructive sleep apnea is driven by obesity, this medication is a powerful new tool. At Banner Peak Health, we’re watching this space closely and incorporating it into our treatment conversations when appropriate.
Today’s Takeaways
Sleep is the foundation of good health. That’s why Banner Peak Health stays at the forefront of sleep science.
The old model of sleep apnea care (test only the sickest, prescribe only CPAP) left too many patients undiagnosed and undertreated. With longitudinal monitoring through tools like the SleepImage ring, we’re identifying mild-to-moderate OSA in patients who would have fallen through the cracks. And with stacking therapy, we’re treating them with personalized, tolerable, non-CPAP options.
If you snore, feel fatigued, or have risk factors for OSA, don’t wait for obvious symptoms to appear. Reach out to us today. We can screen for sleep apnea quickly and comfortably, and if treatment is needed, we have more options than ever.
Optimizing your sleep can improve your body temperature regulation at night, energy, cognition, and cardiovascular health.

Does Alcohol Cause Inflammation? What the Latest Research Says
For years, I felt justified reaching for a glass of wine at the end of the day. Medical science seemed to back me up: moderate alcohol consumption was supposed to protect my heart and extend my life.
The medical community is now pulling the floor out from under this comfortable assumption. Does alcohol cause inflammation, and if so, how much damage does it actually do?
This question is getting more attention now than ever before, and the answer changes how physicians evaluate alcohol’s impact on the body. Through inflammation, alcohol exerts more damage than most people realize.
I’ve written about the pitfalls of nutritional research and the challenges of interpreting epidemiological data. Many of the same challenges apply to alcohol research, and the story starts with two competing graphs.
Does Alcohol Cause Inflammation at Every Dose?
For decades, the prevailing model for alcohol and health followed a J-shaped curve. The bottom of the J sat at “mild” consumption, suggesting a small amount of drinking carried less risk than drinking none at all. Moderate-to-heavy consumption then climbed steeply on the harm scale.
This J-curve felt reassuring. It gave mild drinkers a scientific excuse.
The problem is that the data behind the J-curve is riddled with confounders. The “no alcohol” group in most epidemiological studies isn’t a collection of people who simply chose not to drink. It includes recovering alcoholics who’ve already suffered organ damage, frail or chronically ill individuals, and people taking medications that interact badly with alcohol.
These confounders skewed the harm score for the zero-alcohol group, making mild drinking look protective by comparison.
The updated model is a straight line: zero alcohol equals zero harm, and every incremental dose increases the risk. This linear model reflects the direction of current medical consensus. The CDC now recognizes no beneficial amount of alcohol.

What Is Inflammation?
In the short term, inflammation is a coordinated response between the immune and nervous systems. A host of cells work together to fight acute threats, primarily infectious agents like viruses and bacteria. This defense is adaptive: mount a short-term battle, kill the invader, and heal.
The trouble begins when this system, built for short bursts, is stimulated chronically. Long-term inflammation becomes the opposite of protective: it damages tissues, disrupts organ function, and drives disease.
Alcohol causes inflammation, and this process is now recognized as one of the primary mechanisms by which drinking harms the body. Traditionally, we focused on alcohol’s direct toxicity to the liver. We now know alcohol causes inflammation in every organ system.
How Does Alcohol Cause Inflammation in the Body?
The pathway from a glass of wine to a system-wide inflammatory response involves several steps.
First, the liver breaks down alcohol into acetaldehyde, a directly toxic chemical. Acetaldehyde generates reactive oxygen species (free radicals) that damage liver tissue on contact. This isn’t an inflammatory mechanism; it’s direct chemical toxicity to the organ responsible for detoxifying the body.
Second, alcohol acts as a contact toxin to the lining of the digestive tract. The gut lining functions much like skin: it’s a barrier protecting the body’s interior from the contents passing through. This protection depends on tight junctions between cells lining the intestinal wall.
Alcohol disrupts these junctions, creating what’s known as “leaky gut.” Once the barrier breaks down, bacterial products like lipopolysaccharides (LPS) leak into the bloodstream. These trigger a potent immune response, releasing inflammatory chemicals (cytokines such as TNF-alpha and IL-6) that circulate through the entire body.
Third, alcohol disrupts the gut microbiome. Trillions of bacteria line our digestive tract, and our health is tied to the quality and diversity of these microbial communities.
Prebiotic supplements and gut health strategies can support beneficial bacteria, but alcohol works against them, killing off good strains and allowing harmful ones to flourish.
The result: a local insult in the gut and liver escalates into a body-wide inflammatory state affecting the brain, heart, bones, muscles, and immune system.
Does Even Moderate Alcohol Cause Inflammation?
The short answer is no. The latest alcohol guidelines from the CDC and WHO recognize no safe amount of alcohol from a health perspective.
The J-curve’s apparent benefits were artifacts of confounded epidemiological data, not genuine protective effects of moderate drinking.
Every incremental unit of alcohol confers greater physiologic harm. You can still enjoy a glass of Cabernet Sauvignon, but you can’t claim your doctor said it was good for you.
Alcohol-Related Inflammation: A Full-Body Impact
Does alcohol cause inflammation beyond the gut and liver? Absolutely. Once inflammatory cytokines enter the bloodstream, they reach every organ.
Here’s what the damage looks like in practice.
Liver
The liver is ground zero for alcohol-related damage. It metabolizes alcohol and bears the brunt of acetaldehyde’s toxicity. Over time, the damage follows a predictable progression: fatty liver (affecting 90–100% of heavy drinkers), steatohepatitis (active inflammation of the liver), and eventually fibrosis and cirrhosis (scarring).
Symptoms include fatigue, abdominal discomfort, and jaundice. End-stage liver disease can be fatal.
A routine metabolic panel can detect elevated liver enzymes long before symptoms appear, making regular blood testing one of the most practical early-warning tools.
Digestive Tract and Pancreas
Alcohol directly damages the intestinal lining and promotes leaky gut, as described above. The pancreas is especially vulnerable to alcohol-driven inflammation: pancreatitis can be acute or chronic, and both forms are serious.
Acute pancreatitis causes severe abdominal pain and can be life-threatening. Chronic pancreatitis leads to scarring and loss of function. If the disease destroys the tissue producing insulin, diabetes follows.
Brain
Inflammatory cytokines from the gut and liver cross into the brain, triggering neuroinflammation. Over time, this contributes to alcohol’s effects on the brain: changes in mood, impaired cognition, and structural brain damage.
Even a hangover demonstrates this principle in miniature. If you’ve ever experienced one, you’ve felt firsthand how alcohol disrupts neurological function.
The headache, brain fog, and irritability you feel after a night of drinking are a short-acting version of the same inflammatory process that, over years of heavy drinking, causes lasting harm.
Cardiovascular System
The claim that one or two glasses of wine per day protects the heart rested on confounded data. Wine drinkers tend to eat healthier diets and maintain other habits that promote heart health. The wine itself wasn’t the protective factor.
Alcohol, in a dose- and time-dependent fashion, can cause cardiomyopathy (damage to the heart muscle that weakens its ability to pump), atrial fibrillation (irregular heart rhythm), and elevated blood pressure. Multiple pathways exist for cardiovascular harm.
Immune System
The chronic inflammation alcohol causes overstimulates the immune system to the point it can no longer perform its primary job of defending the body from invading pathogens. The immune system becomes distracted, locked in a chronic inflammatory state, and loses effectiveness against acute threats.
Chronic drinkers face a higher risk of poor outcomes from infections like bacterial pneumonia. We observed this pattern during COVID-19.
Bones and Muscles
The same inflammatory cytokines that damage organs alter how the body metabolizes bone, increasing the risk of osteoporosis. The inflammation alcohol causes can accelerate muscle wasting (sarcopenia), making resistance training for longevity even more valuable for individuals who drink.
Cancer Risk
Alcohol is a confirmed risk factor for multiple cancers. The data is most notable for breast cancer: in women, even one drink per day can increase risk.
We’ve covered strategies for reducing your overall cancer risk in a previous post, and limiting alcohol intake is among the most impactful changes you can make.
What Happens When You Stop Drinking
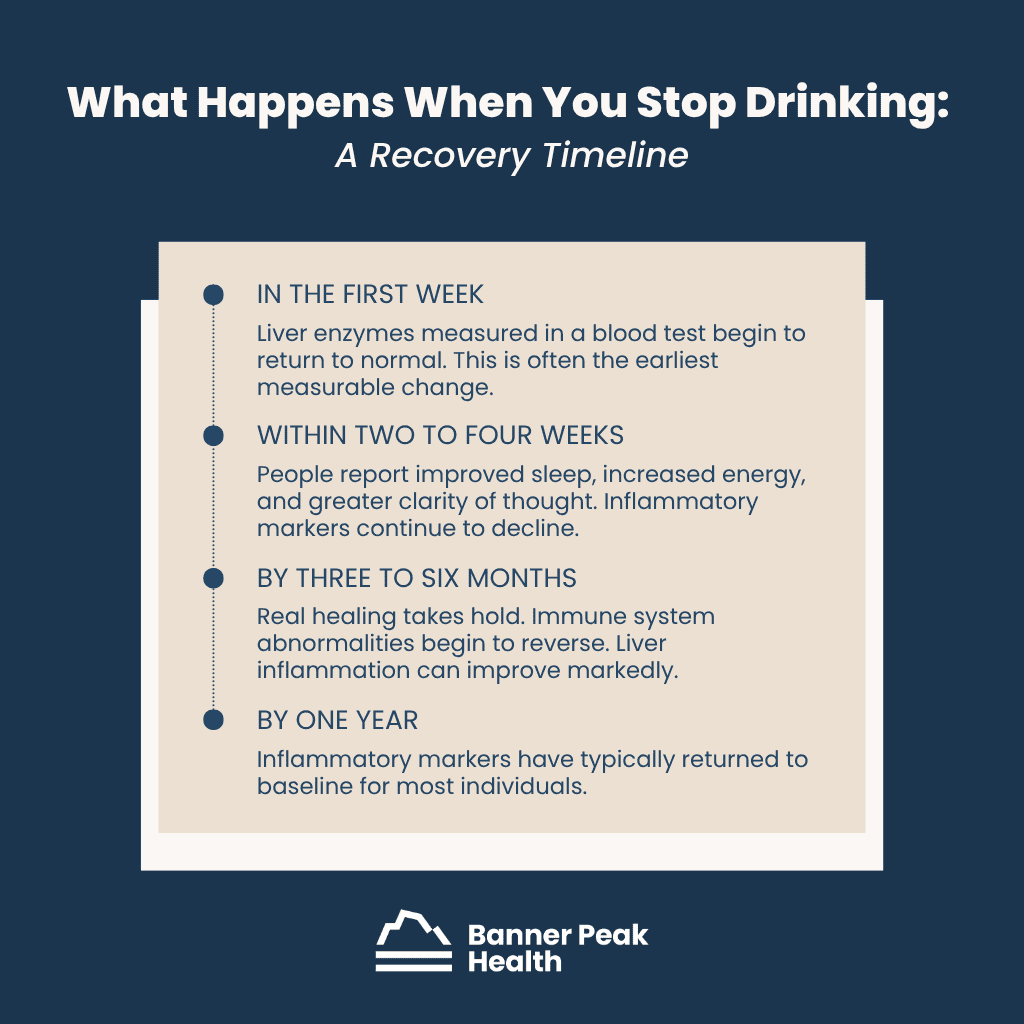
The body has a real capacity for recovery once alcohol is out of the equation. Here’s a general timeline.
In the first week, liver enzymes measured in a blood test begin to return to normal. This is often the earliest measurable change.
Within two to four weeks, people report improved sleep, increased energy, and greater clarity of thought. Inflammatory markers continue to decline.
By three to six months, real healing takes hold. Immune system abnormalities begin to reverse. Liver inflammation can improve markedly.
By one year, inflammatory markers have typically returned to baseline for most individuals.
The caveat: some damage is irreversible. Cirrhosis, structural brain damage, and advanced muscle wasting may not fully recover. The ongoing inflammatory process, however, will resolve once alcohol is no longer fueling it.
Today’s Takeaways
Alcohol has been part of human culture for as long as we’ve been human, and it serves real social and communal purposes. I’m not telling anyone how to live their life. I’m presenting the data so you can make a clear-eyed decision about your own risks and benefits.
Those risks have been underplayed for too long. We now know that alcohol causes inflammation throughout the body, not just in the liver, and this inflammation drives disease in nearly every organ system.
The old J-curve gave us permission to pour another drink. The straight line takes that permission away.
To get a personalized assessment of how alcohol is affecting your body, work with your physician. At Banner Peak Health, this is part of what we do: through a thorough executive physical and ongoing care, we help our members weigh the risks and benefits of lifestyle choices, including alcohol use, with data to back them up.

Can Anxiety Cause High Blood Pressure? A Physician Explains
If a patient asked me, “Is it too hot in Omaha, Nebraska?” I couldn’t answer without more information. Is it morning or noon, winter or summer? Context changes the answer.
The same principle applies to blood pressure. Like the weather, blood pressure is always on the move, rising and falling throughout the day. A single number, taken out of context, can be as misleading as a cholesterol reading without a calcium score.
If this concept, that context dictates the answer, is the only information you take away from this blog post, the read was worth your time.
Can Anxiety Cause High Blood Pressure?
Yes, anxiety can cause high blood pressure temporarily. When we feel stressed, our bodies translate the emotional experience into biology through hormones like adrenaline and cortisol. These hormones increase heart rate, constrict blood vessels, and increase blood flow throughout the body.
The result: blood pressure goes up. Chronic stress can even change the way our bodies store and distribute fat, compounding the cardiovascular burden over time. Whether that spike is harmful depends, once again, on context.
We evolved this hormonal surge, called the sympathetic response, to give us power when we need it. Our ancestors needed that rush of adrenaline to escape a saber-toothed tiger. The response is adaptive; it kept our species alive.
The distinction is duration. If the spike is temporary, it’s adaptive. If stress and high blood pressure become chronic, it’s no longer protective; it’s a disease called hypertension, and it damages blood vessels, the heart, and organs over time.
White Coat Hypertension: The Modern Saber-Toothed Tiger
We’ve all lived this scenario: You left for the doctor’s office late. Traffic was worse than expected. The parking lot was full. The office was on the second floor, and you couldn’t wait for the elevator. You ran up, sat down, and the medical assistant immediately strapped the blood pressure cuff on you.
Under these conditions, the modern equivalent of the saber-toothed tiger has your hormones firing. I’ve experienced this situation myself. I’ve seen my own blood pressure read 150/100 in the office when, on a restful day at home, I’m closer to 120/70. (I’ve written about my high blood pressure experience in more detail on our blog.)
This phenomenon is called “white coat hypertension.” A white coat is what physicians traditionally wore in medical settings. If you know what a phone booth is, you probably remember the white coat, too. And if you remember the little plastic adapter for 45 RPM records, it’s time for a colonoscopy.
White coat hypertension affects 15–30% of people who get blood pressure readings in a doctor’s office. Even without rushing to get there, the environment itself can trigger enough cortisol and adrenaline to produce an artificially elevated reading.
How to Get an Accurate Blood Pressure Reading
If anxiety and blood pressure readings are so closely tied to context, the next logical question is: what are the correct conditions for an accurate reading?
The American Heart Association guidelines are specific.
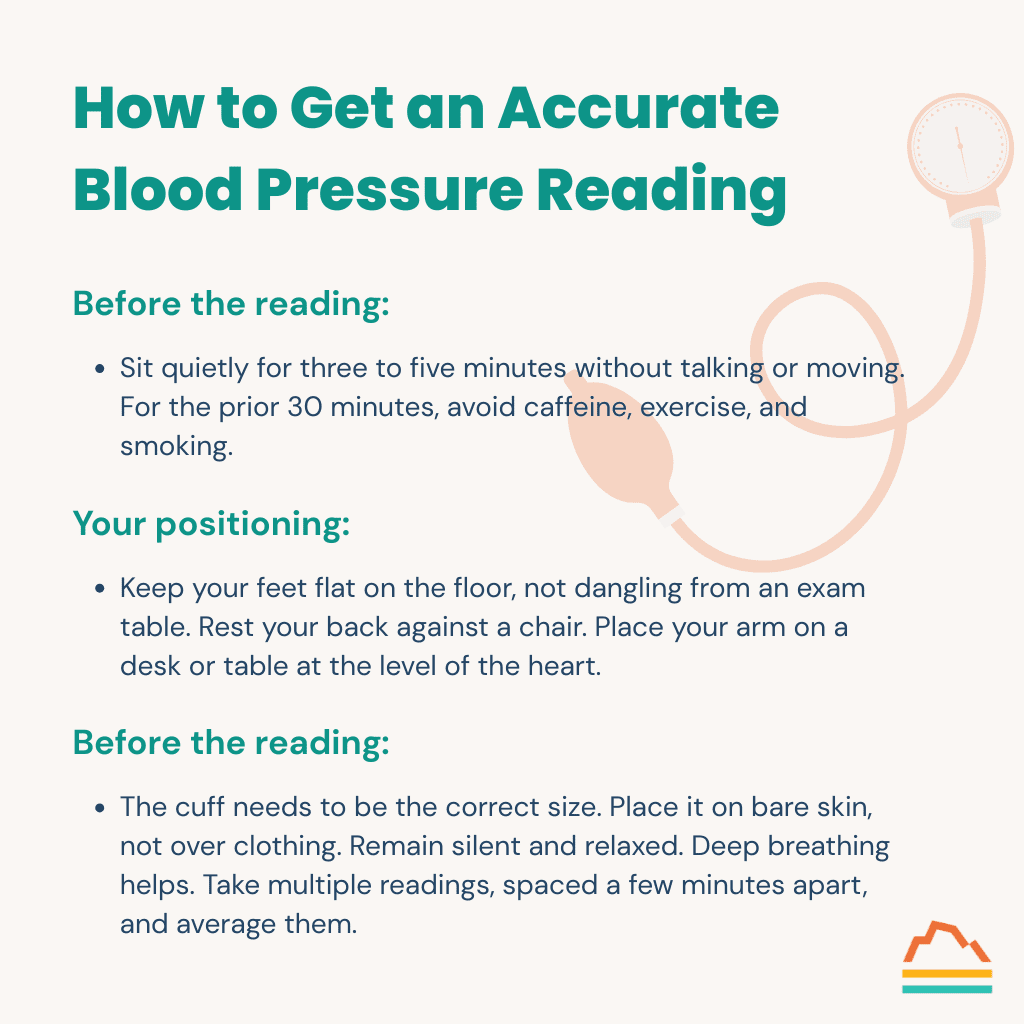
Before the reading: Sit quietly for three to five minutes without talking or moving. For the prior 30 minutes, avoid caffeine (and know how long caffeine stays active in your system), exercise, and smoking. Empty your bladder.
Your positioning: Keep your feet flat on the floor, not dangling from an exam table. Rest your back against a chair. Place your arm on a desk or table at the level of the heart. That last point deserves special attention, and you can test it on yourself right now.
At the top of your sternum (the bone in the center of your chest), you’ll feel a small V-shaped notch called the sternal notch. At the very bottom of that bone, before it gives way to your abdomen, you’ll find a small point called the xiphoid process.
Halfway between those two landmarks is where your heart sits. The blood pressure cuff on your arm needs to be at that height.
If the cuff sits below the level of your heart, the reading will be falsely elevated. I can’t overstate how often I see this done incorrectly.
One more detail: Your arm must be passively supported at that height. Using muscle tension to hold your arm up changes how the artery runs through the bicep and skews the reading.
During the reading: The cuff needs to be the correct size. Place it on bare skin, not over clothing. Remain silent and relaxed. Deep breathing helps. Take multiple readings, spaced a few minutes apart, and average them.
Following all these rules is nearly impossible during a typical doctor’s office visit. Getting an accurate picture of your blood pressure requires monitoring at home.
Modern home blood pressure cuffs are fairly accurate. Try different times of day, follow the rules above, and bring the results to your next appointment.
Can Repeated Anxiety Spikes Lead to Chronic Hypertension?
Yes. The medical literature shows an association between frequent anxiety-driven spikes and the development of chronic hypertension.
The more nuanced question is causality. Are the spikes themselves causing chronic high blood pressure? Or does anxiety, more broadly, skew your hormonal balance over time, and that hormonal imbalance is what drives hypertension?
It’s a distinction without a difference. Anxiety management tools are blood pressure management tools. Addressing anxiety, whether through breathing techniques like belly breathing, exercise, sleep, or other stress-reduction practices, directly supports cardiovascular health.
True Hypertension vs. a High Blood Pressure Reading
A single elevated reading in the doctor’s office doesn’t mean you have hypertension. True hypertension is what you discover when you follow all the rules at home, take readings at different times of day, average the results, and still see elevated numbers consistently.
The medical community categorizes blood pressure into stages: normal, elevated, stage 1 hypertension, and stage 2 hypertension. Each stage has specific numerical cutoffs that guide treatment decisions. For a detailed breakdown of those stages, refer to our post on how long blood pressure medicine takes to reach its full effect.
If your home readings confirm pre-hypertension or hypertension, that’s the starting point for a conversation with your physician about management.
Managing Anxiety and High Blood Pressure
For mild elevations without additional risk factors, your physician will likely start with lifestyle modifications:
- More sleep
- Regular exercise (even walking 10,000 steps a day can make a measurable difference)
- Weight management
- Reduced alcohol intake
- Stress reduction (wearable devices that track heart rate variability can help you monitor stress levels and measure your progress)
If lifestyle changes don’t bring your numbers into range, or if your blood pressure is higher and you have additional risk factors, you’ll enter a discussion with your physician about medication. The prescription for managing high blood pressure is always lifestyle plus or minus medication.
You won’t be told to skip the lifestyle changes and rely on pills alone. Pharmacologic treatment builds on maximizing every non-drug intervention first.
Today’s Takeaways
Anxiety can cause high blood pressure temporarily, and over time, chronic anxiety may contribute to true hypertension.
Invest in a high-quality home blood pressure cuff and learn the rules for accurate measurement. Next time you get your blood pressure checked in a healthcare setting, advocate for proper technique. The staff taking your reading may not have the time or awareness to follow every guideline, but now you do.
At Banner Peak Health, we spend time helping our patients distinguish between a stress-driven spike and a true pattern of hypertension. That distinction, and the personalized management plan that follows, is the kind of care we believe every patient deserves.

5 Weird Signs of Iron Deficiency Your Doctor Might Not Mention
Most people equate iron deficiency with anemia: feeling tired, looking pale, and running low on energy. That picture isn’t wrong, but it’s incomplete.
Anemia means your blood doesn’t carry enough hemoglobin, the protein in red blood cells that delivers oxygen from your lungs to the rest of your body. About 60% of your body’s iron lives in hemoglobin, which is why routine bloodwork and lab testing focus on red blood cell counts. The other 40% does work that most patients never hear about.
Iron deficiency symptoms affect virtually every system in your body. Iron fuels the enzymes in your mitochondria (your cells’ energy producers), helps your brain manufacture neurotransmitters, builds myoglobin (a local oxygen reserve inside muscle cells), drives DNA synthesis and repair, and supports immune cell function.
When iron runs low, the consequences don’t stop at fatigue. Hair loss, brittle nails, and exercise intolerance are common. The five weird signs of iron deficiency below are ones my patients never see coming.
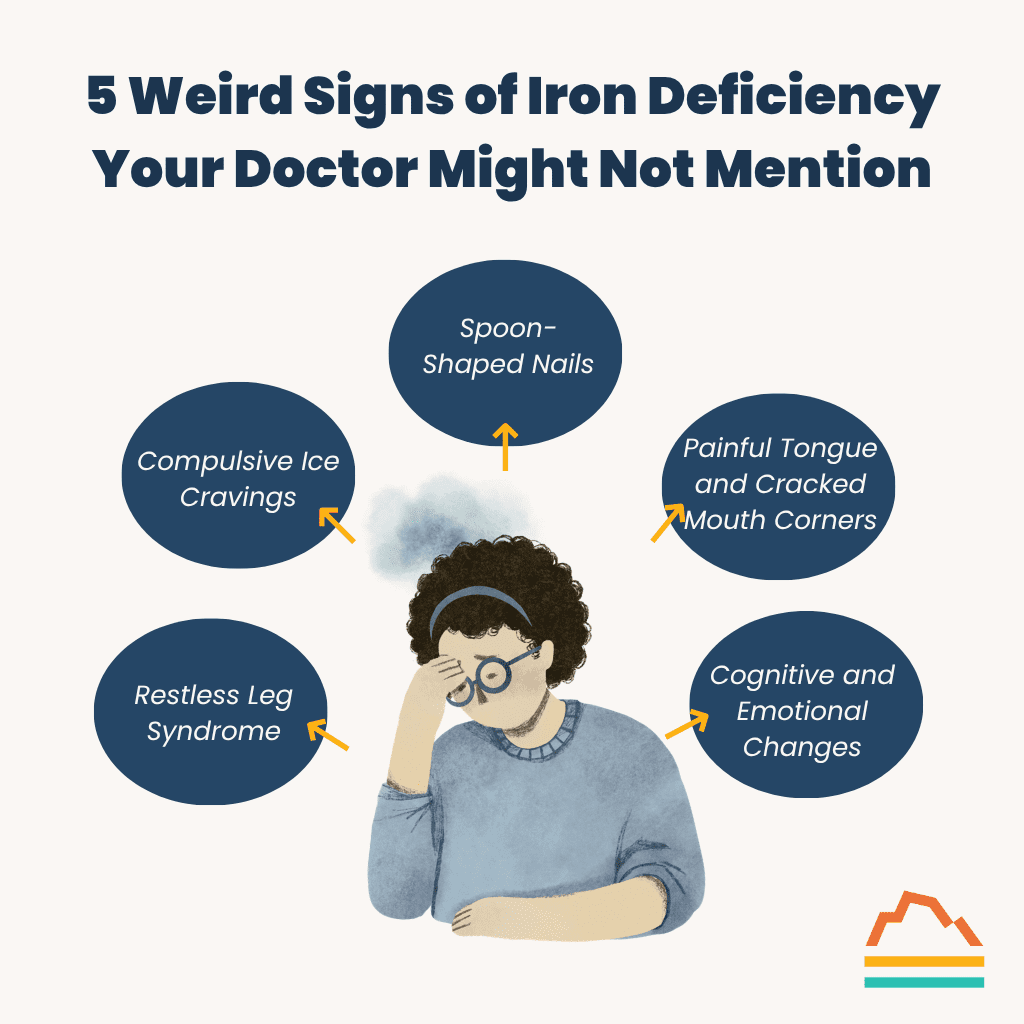
5 Weird Signs of Iron Deficiency Your Doctor Might Not Mention
1. Restless Leg Syndrome
About 30% to 40% of people with low iron develop restless leg syndrome, an uncomfortable and persistent urge to move the legs, especially at rest and at night. The sensation can range from a tingling to an aching that only subsides with movement, and it can be severely disruptive to sleep quality.
The mechanism happens at the brain level. Without adequate iron, your brain can’t produce enough dopamine, and this reduced dopamine production triggers restless leg syndrome. Even when blood iron levels are only mildly low, the brain can experience a severe deficit, making neurological symptoms appear long before anemia shows up on standard labs.
2. Compulsive Ice Cravings
Pagophagia, the medical term for compulsive ice chewing, occurs in 40% to 50% of iron-deficient individuals. Patients describe an intense, almost addictive need to chew ice, sometimes consuming bags per day. The craving disappears when iron levels return to normal.
The physiology behind this is one of the most fascinating iron deficiency symptoms I’ve encountered. Chewing ice lowers the temperature in your mouth, which reflexively dilates blood vessels in your brain and increases blood flow to compensate for impaired neurotransmitter production. Studies confirm that iron-deficient individuals experience measurable cognitive improvement from ice chewing, an effect absent in people with normal iron levels.
This reflex explains a familiar phenomenon: ice cream headaches. Brain freeze causes the same blood vessel dilation mechanism, but in a person who doesn’t need the extra blood flow to the brain.
The dilation becomes painful instead of therapeutic. It’s two sides of the same coin.
3. Spoon-Shaped Nails
Koilonychia, or spoon-shaped nails, is one of the more visually distinctive low-iron signs. The nails curve upward at the edges, forming a concave shape, almost like a tiny spoon.
Nail bed cells divide rapidly and need functioning DNA synthesis and cell repair pathways to manufacture the nail plate correctly. When iron stores drop, the manufacturing process breaks down, and the nail develops an abnormal shape.
Any cell in the body that turns over quickly, including nail, hair, and skin cells, depends on adequate iron to maintain normal growth.
4. Painful Tongue and Cracked Mouth Corners
A swollen, red, painful tongue (atrophic glossitis) and cracks at the corners of the mouth (angular cheilitis) are among the lesser-known signs of iron deficiency. These symptoms send patients to dentists and dermatologists who may treat the surface-level problem without investigating the underlying cause.
The mechanism is the same rapid cell turnover issue that affects nails: The cells lining your mouth and tongue divide constantly and depend on iron for normal DNA function. When the body depletes its iron stores, those tissues can’t repair and regenerate properly. A thorough annual physical exam that includes ferritin testing can connect these oral symptoms to their true source.
5. Cognitive and Emotional Changes
Of all the weird signs of iron deficiency, this one is the most underdiagnosed and potentially the most damaging. Concentration problems, poor attention, irritability, depression, and heightened stress responses can all stem from inadequate iron.
Iron is necessary for synthesizing dopamine, serotonin, and norepinephrine, three neurotransmitters that regulate nearly every aspect of brain processing. Low iron disrupts the production of these chemical messengers, and the cognitive and emotional symptoms can mimic or overlap with early signs of dementia and mood disorders. These iron deficiency symptoms often reverse with proper treatment, making this one of the most correctable causes of cognitive decline I encounter in practice.
Why Standard Blood Tests Miss Iron Deficiency
Iron deficiency progresses in stages, and standard blood panels only catch the final one.
A complete blood count (CBC) measures hemoglobin, red blood cell size, and red blood cell count. These values don’t drop until iron depletion has advanced to full-blown anemia. By that point, the body has been running on empty for months.
Your CBC is your checking account, the money you spend day to day. Ferritin is your savings account. Your body will drain the savings (ferritin) to keep the checking account (CBC) operational, but the depleted savings still affect your health long before the checking account runs dry. To catch iron deficiency symptoms early, you need a ferritin level drawn alongside your standard metabolic panel.
Ferritin below 30 indicates iron deficiency in otherwise healthy individuals. Some studies suggest patients feel better with levels above 50. If you’re experiencing any of the symptoms above, ask for ferritin testing by name.
What Causes Low Iron Levels
The first step in treating iron deficiency is identifying the root cause. The answer falls into two categories: too little iron getting in, or too much iron going out.
Iron is widely available in the diet from both animal and plant sources, so inadequate intake is rarely the primary culprit (with some exceptions for vegans and vegetarians, who face a slightly higher risk from the lower bioavailability of plant-based iron). The bigger factors are absorption problems and ongoing losses.
Approximately 38% of reproductive-age women have iron deficiency, even without anemia. Menstruation and pregnancy both draw heavily on iron stores. Low-level GI bleeding from ulcers or polyps is another common source of loss.
One of the most overlooked causes of low iron levels in modern medicine is impaired absorption due to acid-suppressing medications. Millions of people take proton pump inhibitors (brand names like Prilosec and Protonix) and H2 blockers (like Pepcid) for GERD and gastritis. The body needs an acidic stomach to absorb iron from food, and these drugs reduce that acidity.
If you’re taking acid-suppressing medications and noticing any of the symptoms above, discuss GI health and supplementation with your physician.
Today’s Takeaways
Low iron manifests in ways most people would never anticipate. Restless legs, compulsive ice chewing, misshapen nails, oral tissue breakdown, and cognitive decline are all the five weirdest signs of iron deficiency standard blood tests can miss.
The cognitive and emotional impact of iron deficiency may be the most consequential and the most treatable. Anyone experiencing unexplained concentration problems, mood changes, or persistent fatigue deserves a ferritin test alongside a CBC. This is one of the most prevalent and most correctable causes of symptoms that patients and physicians alike tend to overlook.
At Banner Peak Health, we’re incorporating ferritin testing more broadly into our routine screening. If any of these signs of iron deficiency sound familiar, contact us to schedule a visit. A single blood draw can provide answers that change how you feel and function every day.