For years, I’ve been part of a Sunday morning bicycling group with other men around my age. We call ourselves “MAMILs”: Middle-Aged Men In Lycra. Given our ages, health inevitably dominates our conversations.
I noticed these discussions often revolve around single health metrics: a cholesterol level, a glucose reading, a weight measurement, or a body mass index. This got me thinking about how medicine is more complex than isolated numbers suggest.
In fact, focusing on individual metrics can cause us to miss the complete picture entirely.
The Blind Men and the Elephant
An ancient parable from the Indian subcontinent tells of six blind men approaching an elephant for the first time. Each touches a different part of the animal:
- One touches the trunk and declares, “This is a snake.”
- Another feels the leg and says, “No, it’s a tree.”
- The third touches the ear and insists, “You’re both wrong. It’s a fan.”
- The fourth examines the tusk and pronounces, “It’s a spear.”
- The fifth feels the side and states, “It’s a wall.”
- The last one grabs the tail and concludes, “It’s a rope.”
None is entirely wrong, yet none sees the complete picture. Only by integrating all perspectives can they understand what an elephant really is.
This concept is especially relevant when examining metabolic syndrome.
Understanding Metabolic Syndrome
Metabolic syndrome, also called insulin resistance or pre-diabetes, affects approximately 100 million Americans. It’s not rare, yet we lack a clear understanding of it because it’s amorphous and impacts multiple bodily systems.
The root of understanding this condition lies in the mitochondria, their function, how they produce energy, and how they provide a unified lens for viewing the body and its disease states.
The Mitochondria: Your Body’s Power Plant
Mitochondria are your cells’ powerhouses.
Think of them as tiny oil refineries within each cell. These refineries take food energy (fat and glucose) and create cellular energy in the form of ATP (adenosine triphosphate).
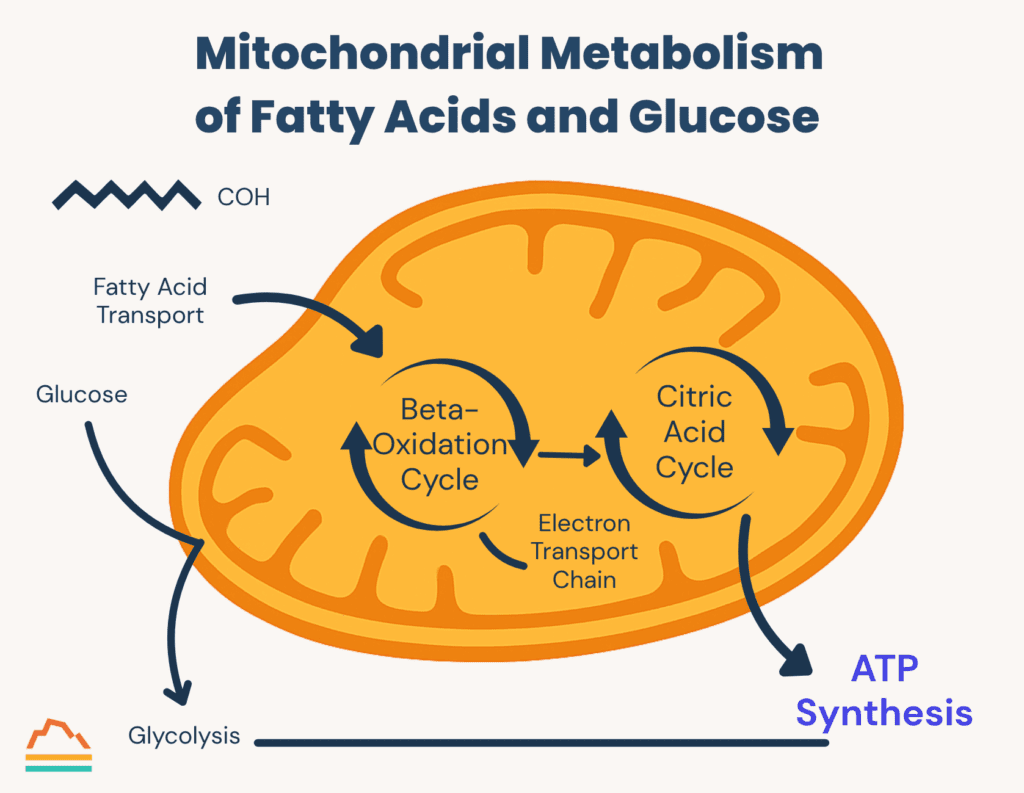
ATP is like gasoline: a high-energy form with chemical bonds that release energy when broken. Just like gasoline powers cars, generators, and heating systems, ATP powers virtually every bodily function:
- Protein synthesis (building your body’s machines)
- DNA repair and regulation
- Cell signaling (including insulin regulation and neural communication)
- Transport of nutrients throughout your body
- Cleanup of cellular debris
- Maintenance of body temperature, pH, and concentration levels
When there’s a problem with energy metabolism, the downstream complications can affect literally every bodily function.
What Causes Mitochondrial Dysfunction?
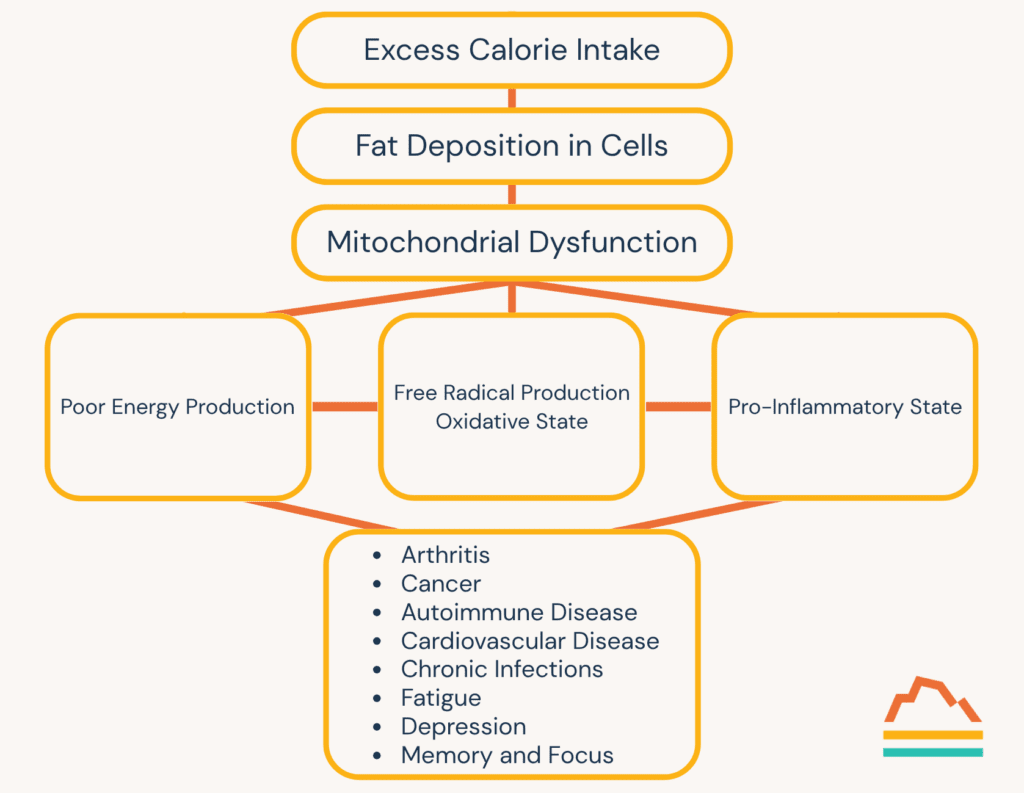
Excess caloric intake causes metabolic syndrome.
When we consume more calories than we burn, our body stores this excess primarily as fat. Initially, this fat distributes to adipose (fat) cells, but it rapidly stores in cells throughout the body, creating problems.
In this environment, mitochondria become overloaded and produce “free radicals,” highly reactive biochemicals that damage adjacent structures. This localized destruction creates a pro-inflammatory state, over-activating our body’s protective inflammatory response.
Additionally, when mitochondria are impaired, they can’t produce sufficient energy. Since mitochondria are present in almost every cell, this energy deficit affects systems throughout the body.
Other lifestyle factors increase the risk of mitochondrial dysfunction:
- Sedentary lifestyle (mitochondria require physical exertion to function properly)
- Chronic stress (elevated cortisol has direct toxicity to mitochondria)
- Sleep deprivation (raises cortisol levels and free radical production)
The Traditional View of Metabolic Syndrome
Metabolic syndrome’s traditional definition requires three or more of these five criteria:
- Fasting glucose greater than 100 mg/dL
- Waistline greater than 35 inches (women) or 40 inches (men)
- HDL less than 40 mg/dL (men) or less than 50 mg/dL (women)
- Triglycerides greater than 150 mg/dL
- Blood pressure greater than 130/85 mmHg
By this definition, approximately one-third of all Americans have metabolic syndrome. For Americans over 60, that number jumps to 50%.
Metabolic dysfunction increases the risk for almost every illness that kills us in modern society: coronary artery disease, many cancers, stroke, Alzheimer’s disease, diabetes, and liver disease. It also increases vulnerability to infectious illnesses like pneumonia or COVID-19.
Beyond these, metabolic dysfunction raises the risk for depression, chronic pain, arthritis, migraines, autoimmune conditions, and even hearing loss.
Moving From “Normal” to “Optimal”
Given how prevalent and dangerous metabolic syndrome is, how can we track it effectively?
When we receive lab results, we typically check if our numbers fall within the “normal” range. If they do, we feel good and move on.
The problem is that “normal” is often defined statistically: you fall within two standard deviations of the population mean. But if most of the population is metabolically unhealthy, what does “normal” really mean?
We need to shift our focus from “normal” to “optimal.”
Let’s examine the metabolic health markers that give us a more nuanced understanding of metabolic function, comparing standard “normal” ranges with truly “optimal” levels.
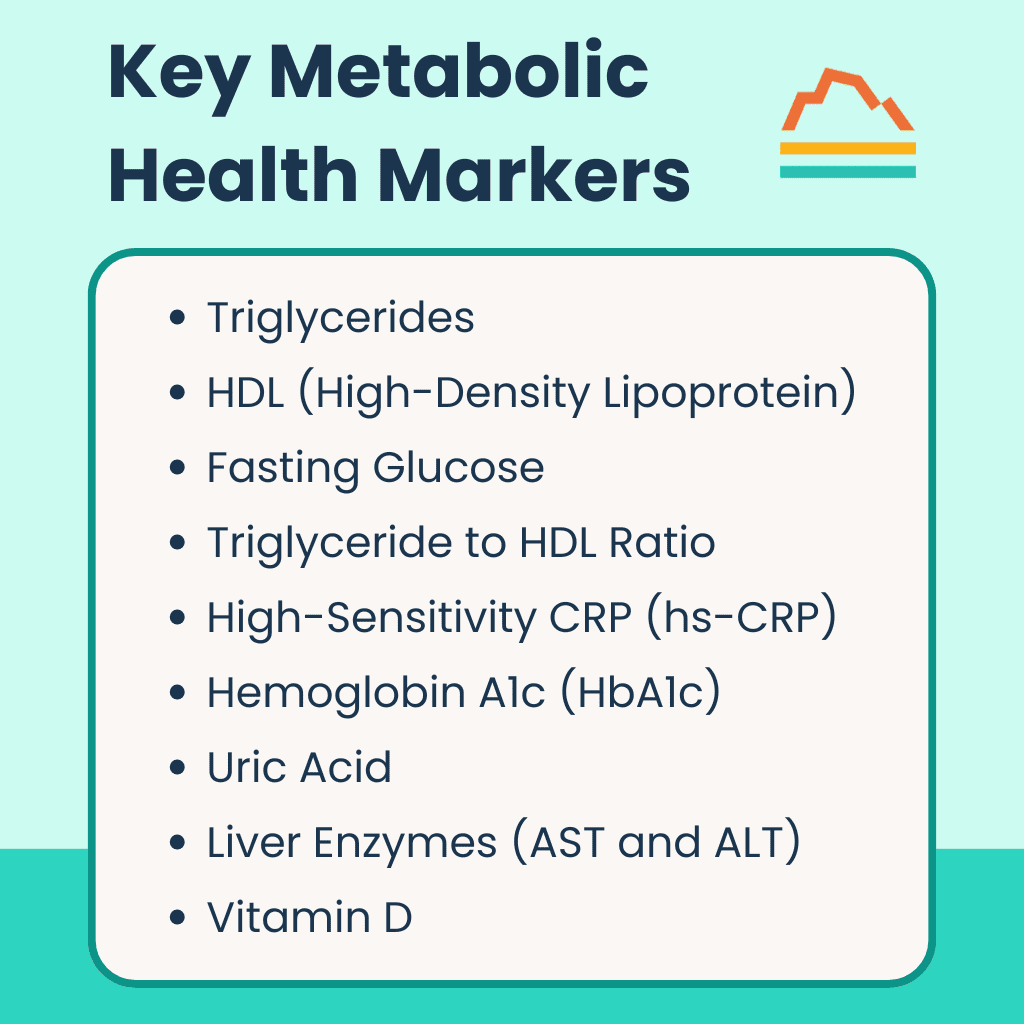 Key Metabolic Health Markers
1. Triglycerides
Triglycerides tell us more about glucose metabolism than fat metabolism.
When confronted with excess glucose, your liver creates surplus triglycerides. The amount circulating in your blood can indicate a surplus.
- Normal range: Less than 150 mg/dL
- Optimal level: Below 80 mg/dL
2. HDL (High-Density Lipoprotein)
While included in the lipid panel, HDL provides more insight into glucose processing. It’s a sensitive marker for insulin resistance. We want more HDL, not less.
- Normal range: Men greater than 40 mg/dL, women greater than 50 mg/dL
- Optimal range: 50–90 mg/dL (for both men and women)
3. Fasting Glucose
Fasting glucose (measured after eight or more hours without food) reflects your baseline hormonal balance rather than what you’ve eaten.
- Normal range: Less than 100 mg/dL
- Optimal range: 70–85 mg/dL
4. Triglyceride to HDL Ratio
This ratio is highly correlated with insulin resistance, yet rarely discussed in standard lab results.
- Normal: Less than 3.0
- Optimal: Less than 1.5
5. High-Sensitivity CRP (hs-CRP)
This marker indicates inflammation anywhere in the body. Given how systemic inflammation plays a role in metabolic syndrome, it helps assess inflammatory response.
- Normal range: 1.0–3.0 (elevated is greater than 3.0)
- Optimal level: Less than 1.0
6. Hemoglobin A1c (HbA1c)
HbA1c reflects your average blood glucose over approximately 90 days. Diabetes risk isn’t binary. It rises gradually even within the “normal” range.
- Normal: Less than 5.7% (5.7–6.4% is pre-diabetes, 6.5%+ is diabetes)
- Optimal: 5.0–5.4%
7. Uric Acid
While traditionally associated with gout, uric acid levels closely correlate with insulin resistance. Elevated uric acid is part of a vicious cycle of worsening insulin resistance and can independently damage blood vessels.
- Normal range: Women 1.5–6.0 mg/dL, men 2.5–6.0 mg/dL
- Optimal range: Women 2.0–4.0 mg/dL, men less than 5.0 mg/dL
8. Liver Enzymes (AST and ALT)
Aspartate transaminase (AST) and alanine transaminase (ALT) are proteins produced in liver cells. With caloric excess, increased fatty acid storage becomes toxic to liver cells, enhancing their death rate and elevating these enzymes.
- Normal range: AST 10–35, ALT 9–46
- Optimal level: Both less than 17
9. Vitamin D
This hormone, made in response to sunlight, affects insulin signaling and production. Low vitamin D is almost invariably found with insulin resistance and diabetes.
- Normal level: Greater than 30
- Optimal level: 40–60
Today’s Takeaways
To truly understand your metabolic health, we can’t act like six blind men looking at an elephant. We must critically examine a wider panel of labs with stricter standards for optimal health.
The gap between “normal” and “optimal” ranges reveals how our current medical system often settles for adequacy rather than excellence. By understanding these metabolic health markers and their optimal ranges, you gain powerful tools to prevent disease and achieve peak performance.
At Banner Peak Health, we provide this level of personalized, detailed analysis as part of our commitment to preventative healthcare. We don’t just want you to be “not sick.” We want you to thrive.